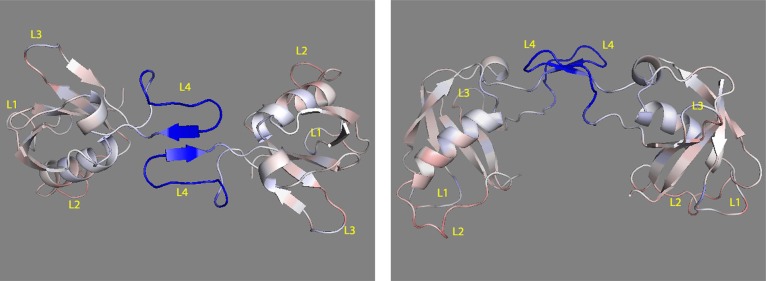
Figure 5.

Plexin-B1 RBD monomer to dimer RMSF change mapped to the structure in top view (left) and in side view (right). Colors range from blue to white to red (with white representing no change in RMSF, blue representing RMSF decrease, and red representing RMSF increase). The nine N- and C-terminal residues are not shown.
