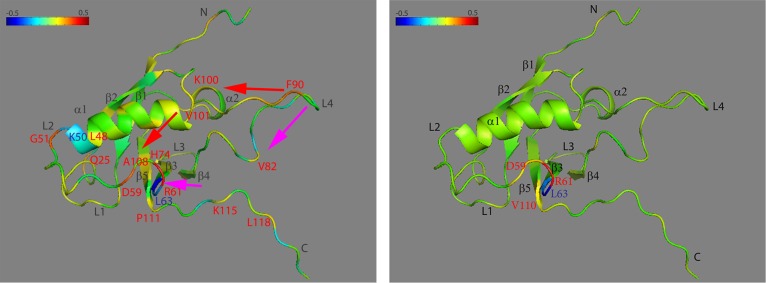
Figure 9.

Structure at residue R61 for RBD monomer (left) and dimer (right) with the correlation coefficient of dihedral angle motions mapped to the main chain Cα (see color scale from −0.5 to +0.5). Key residues and possible signal pathways are labeled in the same strategy as in Figure 8.
