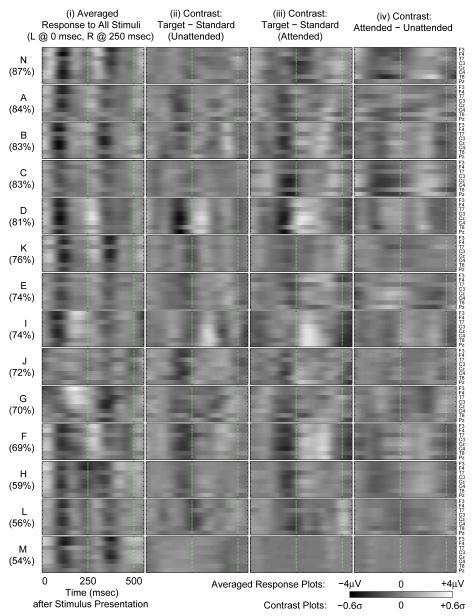
Figure 4.
Each panel shows an 8-channel × 600 msec image of the epoch following the onset of stimuli in the Beeps condition (cf. Figure 5 for the corresponding Words results). Each row of panels corresponds to one subject—they are ordered from top to bottom according to their online performance in the Beeps condition on day 1, which is given in % on the left of the figure. The four columns show four different representations—see text, Section 3.2, for details.

