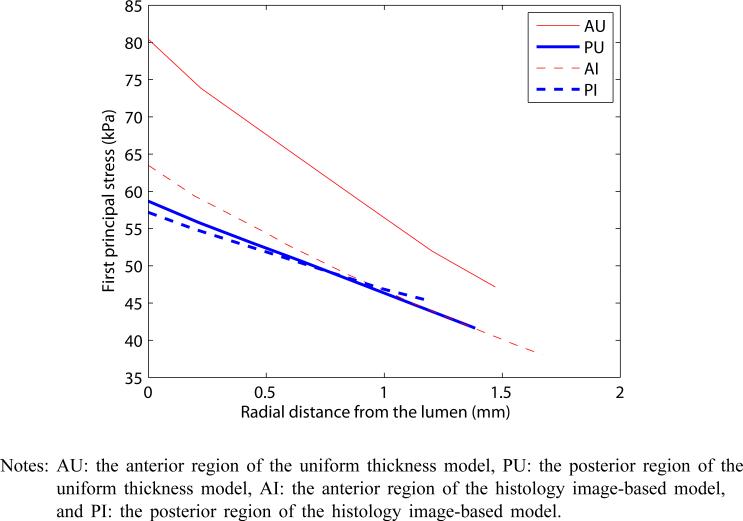
Figure 6.
Comparative plot of the first principal stresses within regions A and P for both models when subjected to an internal pressure of 100 mm Hg (see online version for colours)
Notes: AU: the anterior region of the uniform thickness model, PU: the posterior region of the uniform thickness model, AI: the anterior region of the histology image-based model, and PI: the posterior region of the histology image-based model.

