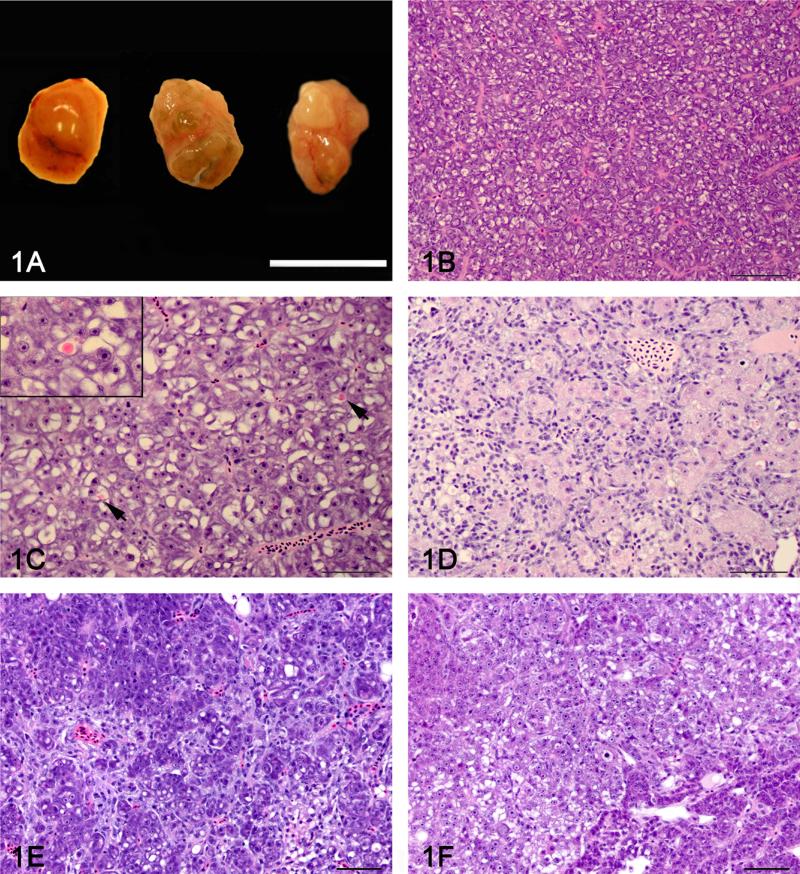
Figure 1.
Gross appearance and histology of control and DMN exposed liver A: Gross appearance of a normal medaka liver (left) and 2 livers with severe hepatic fibrosis (center and right). The liver on the right has a grossly visible neoplasm diagnosed as a hepatocellular carcinoma by histology. Bar = 1 mm. B: Histology of a normal female medaka liver (phenotype 0). C: Hepatocellular degeneration (phenotype 1) characterized by increased hepatocellular vacuolization, presence of globular eosinophilic intra-cytoplasmic inclusions (arrow) and scattered apoptotic hepatocytes. Insert: Close-up of an eosinophilic intra-cytoplasmic inclusion. 100X. D: Biliary preductular epithelial cell hyperplasia (phenotype 2) characterized by proliferation of small cells with hyperchromatic elongated nuclei that separated the hepatocytes and sometimes surrounded individual hepatocytes. E: Hepatic fibrosis (phenotype 3) characterized by increase connective tissue separating and individualizing single or small group of hepatocytes. F: The hepatic fibrosis and neoplasia phenotype (phenotype 4) was defined as hepatic fibrosis with presence of a hepatic neoplasm (Hepatocellular carcinoma or cholangiocellular carcinoma). Hematoxylin and eosin. Bar = 50 μm 40X.

