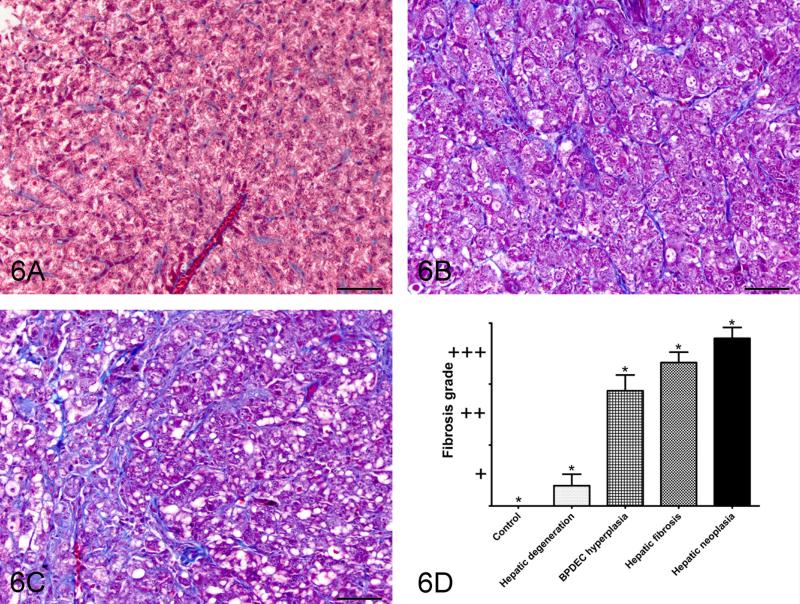
Figure 6.
Masson’s trichrome staining as a semi-quantitative measure of collagen deposition. A: Representative picture of control liver; B: grade 2, moderate fibrosis; C: Grade 3, severe fibrosis/cirrhosis. 40X bar = 50um. D: Relationship between phenotype and the fibrosis grade. Semi-quantitative scoring of Masson’s trichrome stained slides as a measure of collagen deposition.

