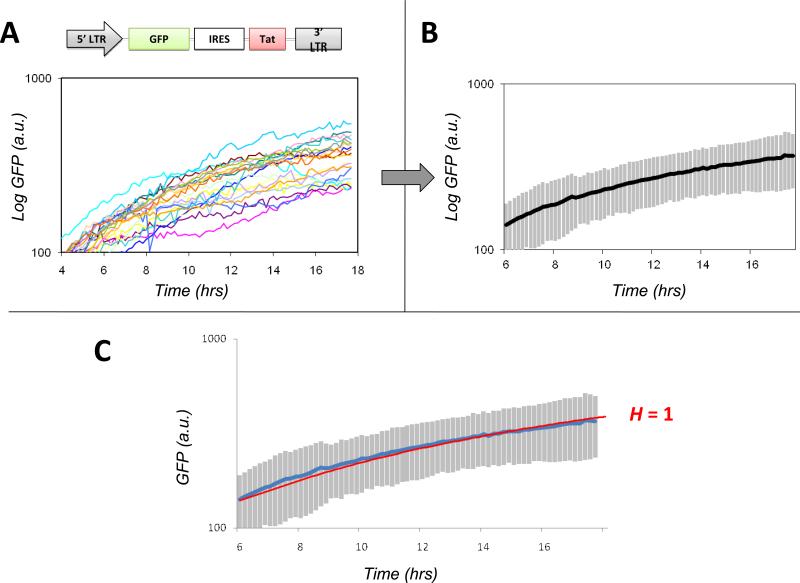
Figure 4. Time-lapse GFP trajectories from individual LGIT-infected cells show that H = 1 for the Tat positive-feedback circuit.
(A) Plot of raw GFP trajectories versustime obtained after image segmentation of a time-lapse confocal microscopy movie of LGIT Jurkat cells immobilized on a glass slide and imaged live for 18 hours after addition of TNFα. Each trajectory represents an individual cell and each trajectory has been pre-processed by background fluorescence subtraction. (B) Plot of the calculated mean of the individual cell trajectories (blackline). Inset: Log-linear plot of the mean that is used for nonlinear least squares regression fitting to mathematical models. (C) Nonlinear least-squares regression fitting of the single-cell datato the mathematical model in Eq. 5. All parameters in Eq. 5 except Hwere fit to a parallel time-lapse movie of LG + TNFα (data not shown, see (15)) and H was allowed to vary. The green line represents the best fit obtained, which is H ≈ 1.Simulations were also performed by fixing the value of H to 0 (blue), 2 (purple), or 3 (red); none of these simulations generated a trajectory that could fit the data nearly as well as H = 1. (fits were performed on log-converted data to minimize the influence of outlier data points, fits trajectories were then back converted to linear scale)

