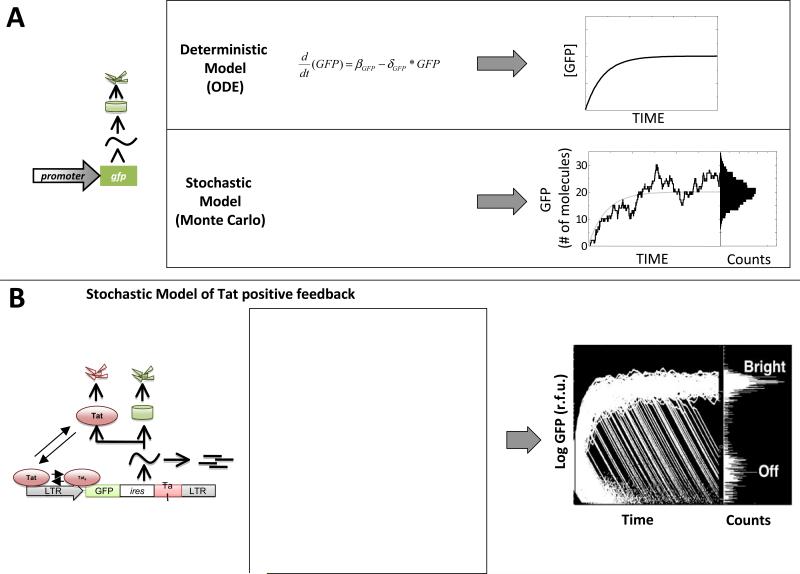
Figure 5. Stochastic fluctuations in the levels of Tat account for the developmental bifurcation of HIV-1.
(A) Deterministic (continuous) ODE models versus stochastic Monte-Carlo models for a simple gene circuit (left). The ODE model (top) generates a single smooth line that approximates the population average of a large population of GFP molecules. The stochastic model (bottom) considers a set of chemical reactions and generates a fluctuating trajectory that represents the number of molecules in the system (e.g. a single cell) over time. When simulated, each trajectory from such a stochastic model will vary and a histogram of GFP can be generated for any point in time.(B) Schematic, reaction scheme, and stochastic simulation results for the LGIT circuit(reproduced from (12)). The reaction scheme models a positive-feedback circuit lacking a bistable threshold (15) and 10,000 individual trajectories (where each trajectory represents a single cell) are shown for simulated time-span of one week to generate the histogram of 10,000 cells at right. The simulated model of Tat positive feedback is sufficient to reproduce the GFP bifurcation from the flow-cytometry data in Figure 1. The initial conditions for this simulation are: all species begin with zero value except LTR (1 copy), Tat (1 - 5 molecules), GFP (25,000 - 125,000 molecules); the parameter values are: kbasai = 10−8/sec, kbind= 0.00015/sec, kunbind= 0.017/sec, kA = 0.001/sec, kD = 0.13/sec, ktransact = 0.1/sec, dccaymRNAn = 0.000048/sec, kexport = 0.00072/sec, kGFP = 0.5/sec, kTat = 0.00132/sec, decaymRNAc = 0.000048/sec, decayGFP = 0.00000301/sec, decayTat= 0.0000043/sec.

