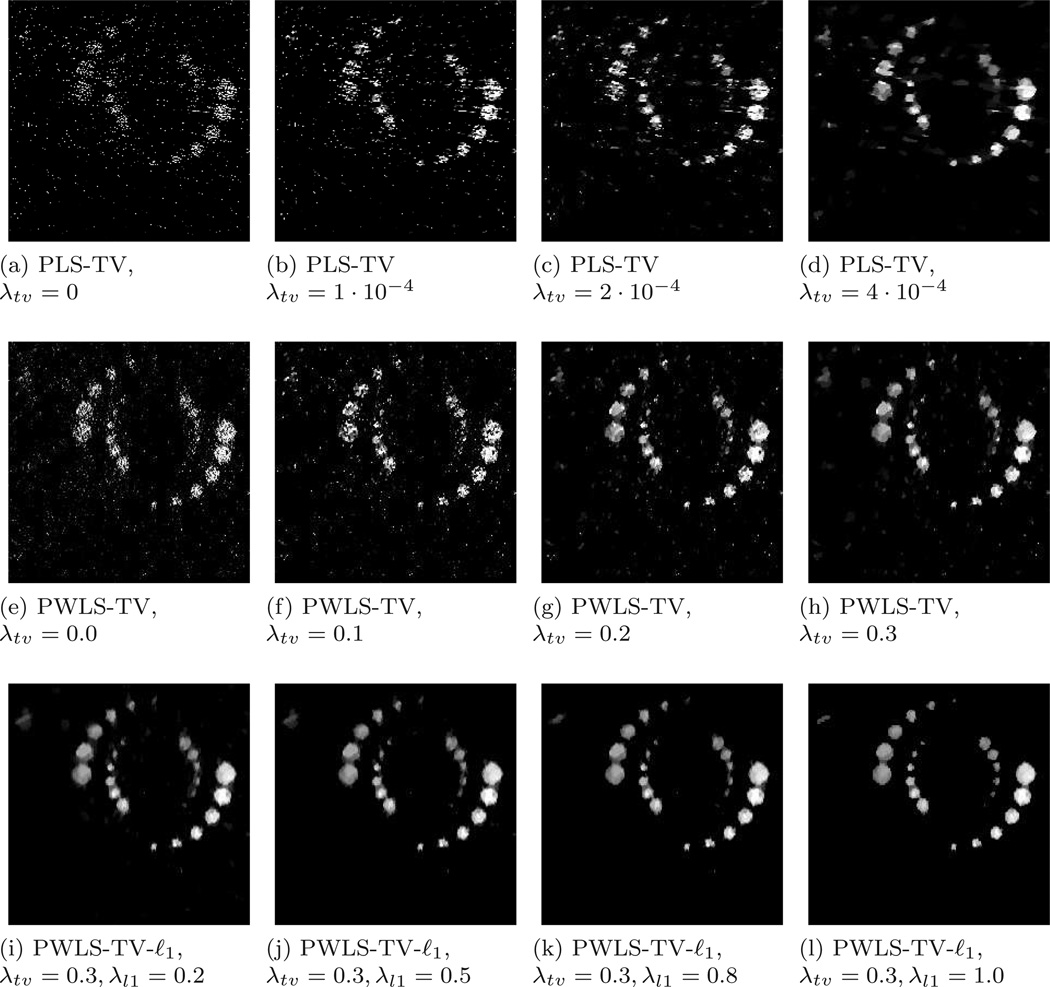
Figure 4.
Computer-simulation studies: Examples of reconstructed K-edge images ROIs for the 200-view case corresponding to different regularization parameter values. All images are cropped to size of 300 × 300 pixels and are displayed in the same grey-scale window. Images reconstructed via PLS-TV (a–d), PWLS-TV (e-h) and PWLS-TV-ℓ1 (i–h).

