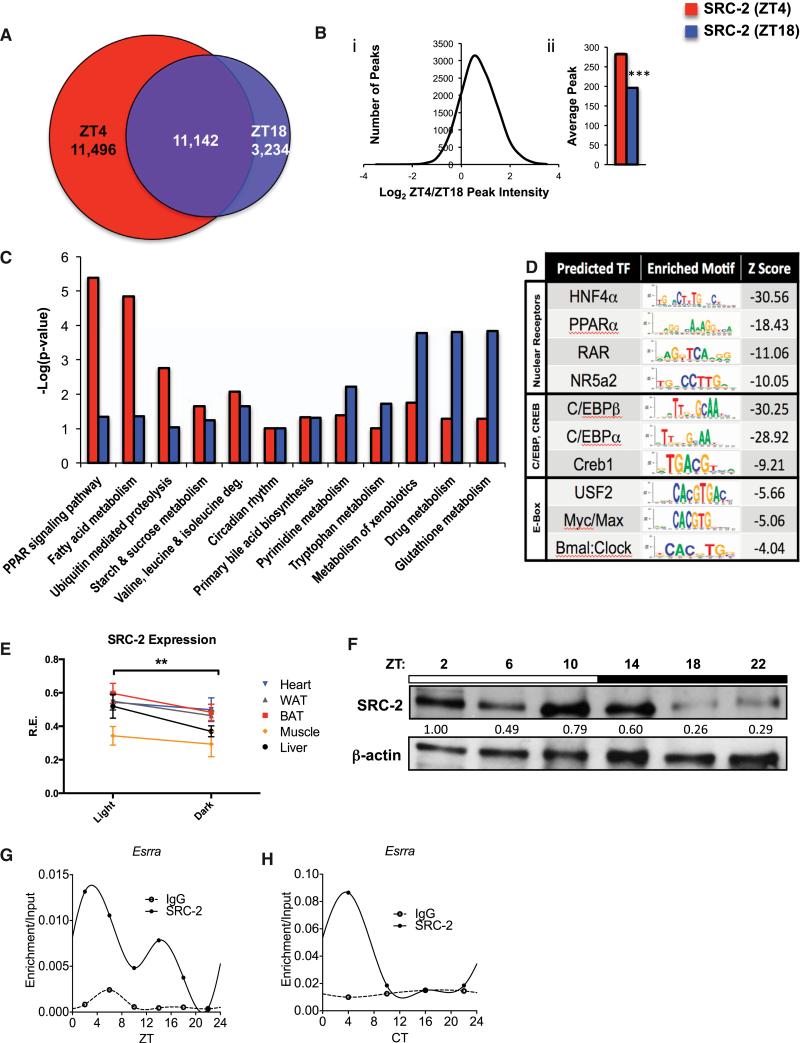
Figure 1. Analysis of Mouse Hepatic SRC-2 Cistromes at ZT4 and ZT18.
(A) Venn diagram comparing SRC-2 ChIP-seq intervals from murine livers at ZT4 and ZT18.
(B) Peak intensities of the overlapping binding sites plotted as log2 of SRC-2 (ZT4) over SRC-2 (ZT18) against the number of ChIP peaks (i) and in bar graph form (ii); ***p < 0.001. Data are graphed as the mean ± SEM.
(C) Comparative DAVID gene functional analyses for select enriched annotations of SRC-2 ZT4 and ZT18 targets.
(D) Top enriched SeqPos motifs common to ZT4/ZT18 SRC-2 binding regions, grouped by DNA binding domains of transcription factors.
(E) hd-qPCR expression of SRC-2 in WAT, BAT, heart, skeletal muscle, and liver in entrained WT male mice (n = 5 each) in light and dark phases. Data are graphed as the mean ± SEM. *p < 0.05.
(F) Representative immunoblot of liver SRC-2 in entrained WT mice at ZT2, ZT6, ZT10, ZT14, ZT18, and ZT22.
(G) Validation of 24 hr circadian recruitment of SRC-2 to the Esrra promoter in liver tissue assayed by ChIP-qPCR relative to input at ZT2, ZT6, ZT10, ZT14, ZT18, and ZT22.
(H) Validation of 24 hr circadian recruitment of SRC-2 to the Esrra promoter in liver tissue assayed by ChIP-qPCR relative to input at CT4, CT10, CT16, and CT22.

