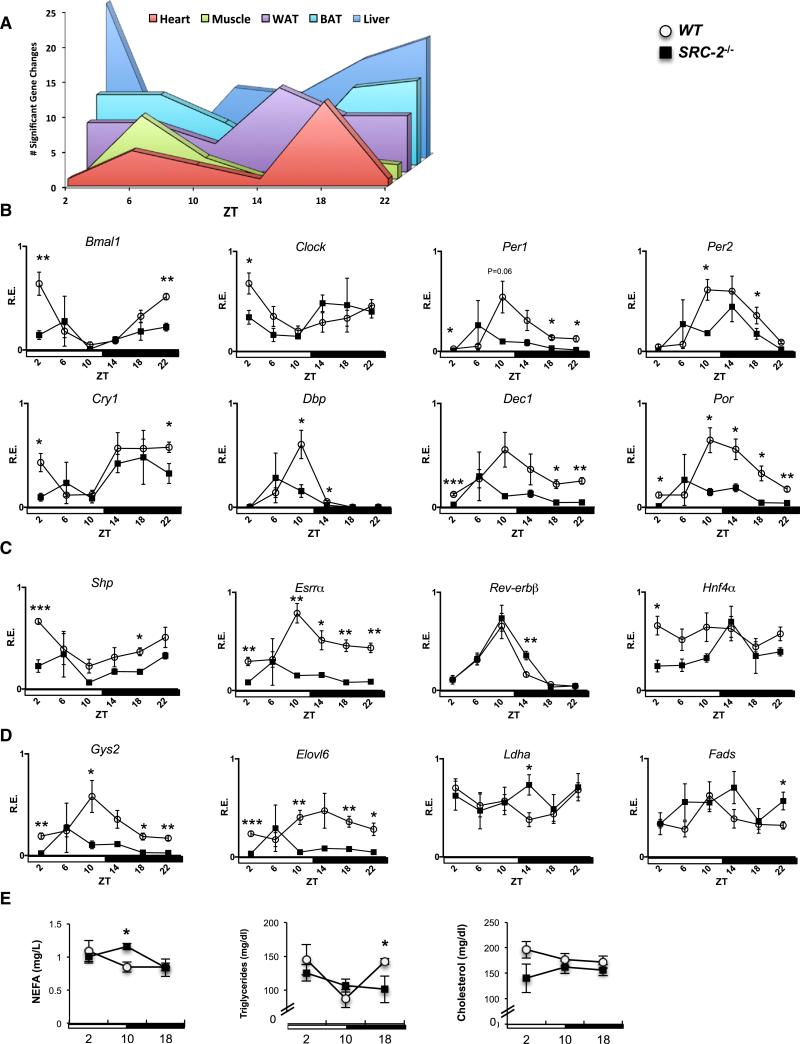
Figure 4. Loss of SRC-2 Results in Aberrant Peripheral Circadian Clock Gene Expression in the Liver.
(A) Graphical summary representation of the gene changes observed at different ZTs in core metabolic tissues using the hd-qPCR array.
(B) hd-qPCR analysis of temporal circadian gene expression in liver from entrained WT and SRC-2−/− (n = 3–5) mice.
(C) hd-qPCR analysis of NR gene expression.
(D) hd-qPCR analysis of metabolic genes. The maximal value from each analyzed gene was normalized to one.
(E) Plasma analysis of NEFAs, triglycerides, and cholesterol at ZT2, ZT10, and ZT18 from WT and SRC-2−/− (n = 3–5) mice. Data are graphed as the mean ± SEM. *p < 0.05, **p < 0.01, ***p < 0.001 versus WT mice.

