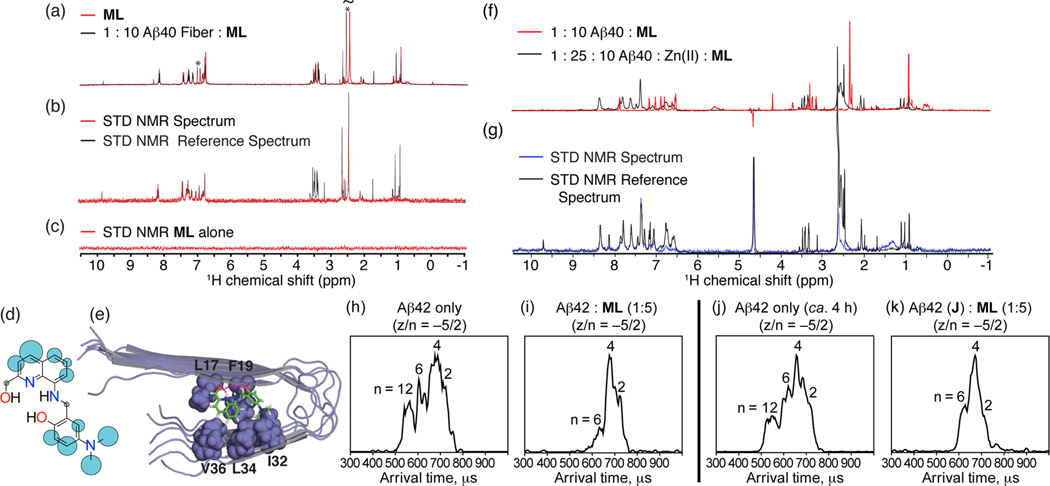
Figure 3.
(a–g) Interaction of ML with fibrillar Aβ40 species by saturation transfer difference (STD) NMR and (h–k) influence of ML on early Aβ42 oligomerization monitored by mass spectrometry and ion mobility studies. (a) Chemical shift changes in the 1H spectra of ML upon the addition of 10 mol % metal-free Aβ40 fibers in 100% D2O (20 mM deuterated Tris–DCl, pD 7.4). Large chemical shift changes can be seen in the aniline ring and dimethylamino groups (marked with an asterisk). (b) 1H STD NMR spectra of ML with Aβ40 fibers (Aβ:ML = 1:10). Comparison of STD signal intensity (red) to the STD reference (black) reflects the relative proximity of the corresponding proton to the Aβ40 fiber. (c) 1H STD NMR spectra of ML alone showing the absence of an STD signal in the absence of Aβ40 fibers. (d) Normalized STD intensities mapped to ML’s structure. Larger blue circles indicate a more intense STD effect; gray circles indicate the absence of an STD signal. (e) Lowest energy docked conformation of ML to Aβ40 fibers (PDB 2LMO). Other docked conformations and a cluster analysis can be found in Supporting Information Figures S4 and S5. (f) Comparison of the 1H spectra of ML (200 µM) with Aβ40 fibers (20 µM) in 100% D2O (20 mM deuterated Tris–DCl, pD 7.4) with (black) and without (red) 500 µM ZnCl2. The large chemical shift changes are evidence of binding of Zn(ii) to ML. (g) 1H STD NMR spectra of ML with Aβ40 fibers in a ratio of 10:1 in the presence of ZnCl2 (500 µM). Arrival time distriubtions (ATDs) for the z/n = −5/2 peak of (h) pure Aβ42 and (i) 1:5 mixture of Aβ42 and ML sample, respectively. (j) ATD for the −5/2 peak of the Aβ42 sample prepared and placed on ice for ca. 4 h. (k) ATD for the −5/2 peak of the preincubated Aβ42 sample immediately following the addition of ML (ca. 5 min).

