FIGURE 3.
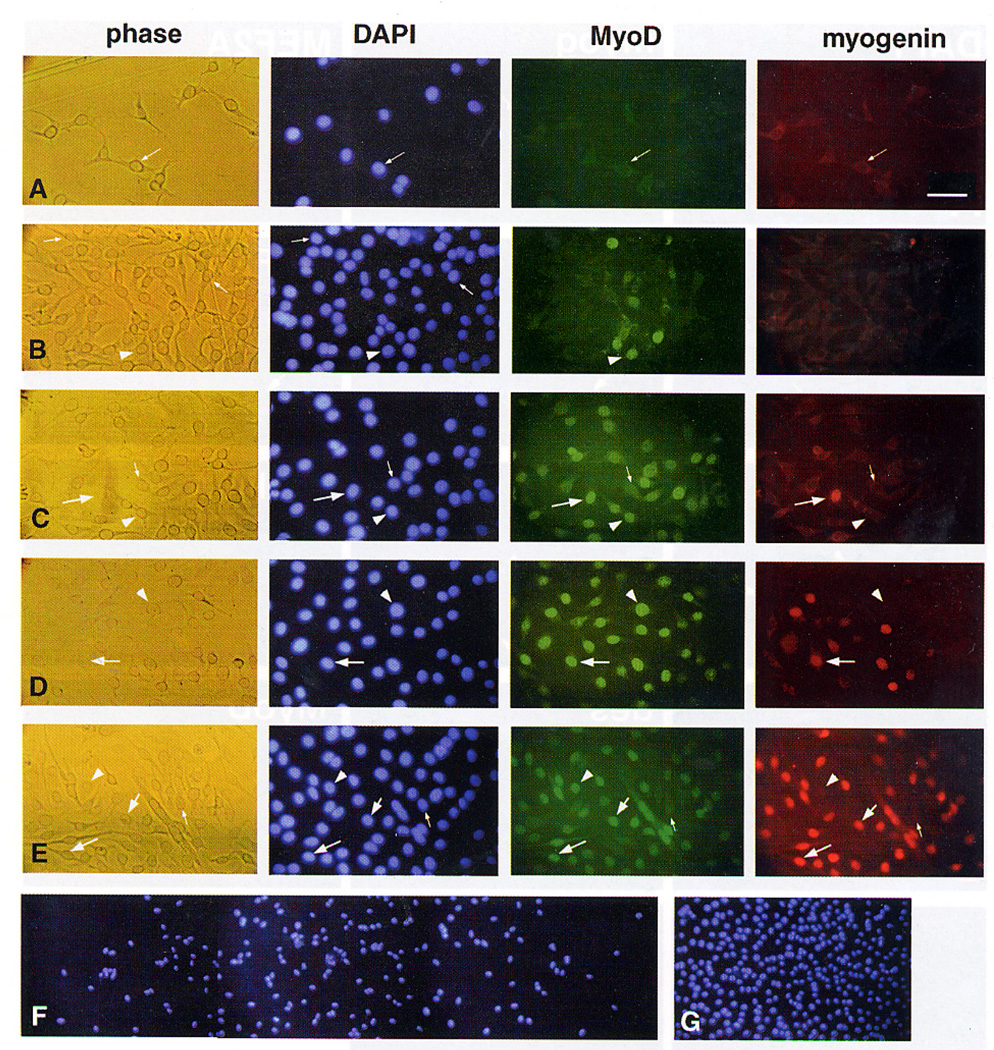
Micrographs demonstrating large clones doubly stained with antibodies against MyoD and myogenin along with DAPI stain of the nuclei (A–E) and an over view of a large clone at lower magnification (F–G). Clones were initiated in proliferation medium and switched following 5 days into medium consisting of 2% FCS (±PDGF). Reactivity with the anti-MyoD polyclonal antibody was visualized with a fluorescein-conjugated secondary antibody and reactivity with the anti-myogenin monoclonal antibody was visualized with a rhodamine-conjugated secondary antibody. (A) Micrographs of the outer region of a large clone whose center is already positive for MyoD and myogenin; culture was maintained for 2 days in the 2% FCS medium (+PDGF). (B–D) Micrographs of central regions of different large clones; cultures were maintained for 2 days in the 2% FCS medium (PDGF was present in B and C and absence in D). (E) Micrographs of the central region of a large clone showing small myotubes; the culture was maintained for 3 days in the 2% FCS medium in the presence of PDGF. (F–G) Lower magnification micrographs of a large clone shown to provide an overview of the density of the cells in (F) the more peripheral region of the clone and (G) the more central region of the clone; culture was maintained for 2 days in the 2% FCS medium with PDGF; nearly all cells in the region shown in panel G were found positive for MyoD, in contrast most cells in the periphery of the region shown in panel F were negative for MyoD. Arrowheads in parallel micrographs mark the position of the cells positive for MyoD but negative for myogenin, larger arrows mark the position of cells positive for both MyoD and myogenin and smaller arrows mark the position of cells negative for both MyoD and myogenin. Micrographs in panels A–E were taken with a 40x objective; bar, 57 µm. Micrographs in panels F–G were taken with a 16x objective; bar 146 µm.

