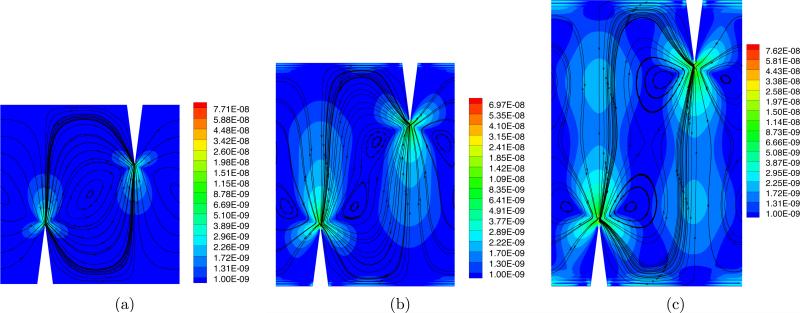
Fig. 8.
Plots particle trajectories for three different cases with fixed value of h = 200 μm and values of H = 600 μm, 750 μm, and 900 μm (cf. Fig 3). The colormap describes the values of the magnitude of the Lagrangian velocity vL, whereas the lines identify the streamlines of vL.

