
Figure 4. Mitochondrial activity is elevated in Rictor-deficient BAT.
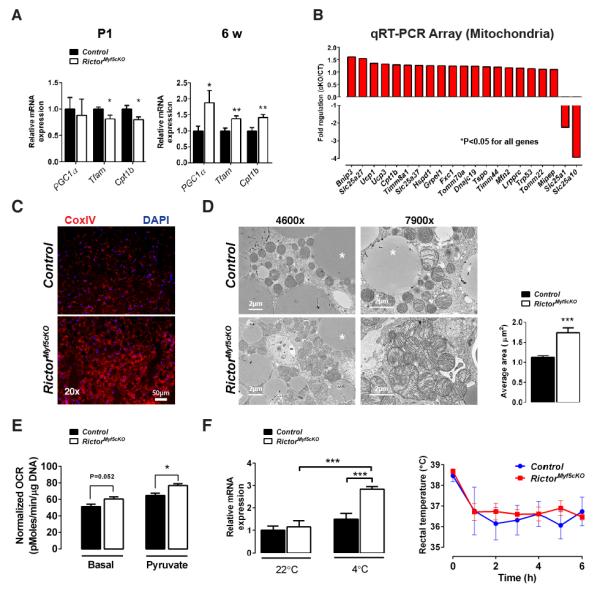
(A) qRT-PCR of mitochondrial genes in P1 (n=6) and 6wk iBAT (n=8) (mean ± SEM; t-test; *p<0.05, **p<0.01)
(B) Differentially expressed genes using mitochondrial qRT-PCR arrays(n=4; t-test; p<0.05)
(C) Representative immunofluorescence images of Cox IV staining in 6wk iBAT (n=3).
(D) (Left) Representative TEM images of 6wk iBAT and (Right) mitochondria size (n=3;mean ± SEM; t-test; ***p<0.001)
(E) Oxygen consumption of iBAT using a Seahorse Flux Analyzer (12 wks, n=5; normalized to DNA content;mean ± SEM; t-test; *p<0.05)
(F) (Left) qRT-PCR of Ucp1 mRNA in iBAT with or without cold exposure (n=3 for 22°C; n=4 for 4°C; mean ± SEM; two-way ANOVA; ***P<0.001) and (Right) rectal temperature in acute cold challenge (n=4; mean ± SEM; t-test; no significant difference).
See also Figure S4.