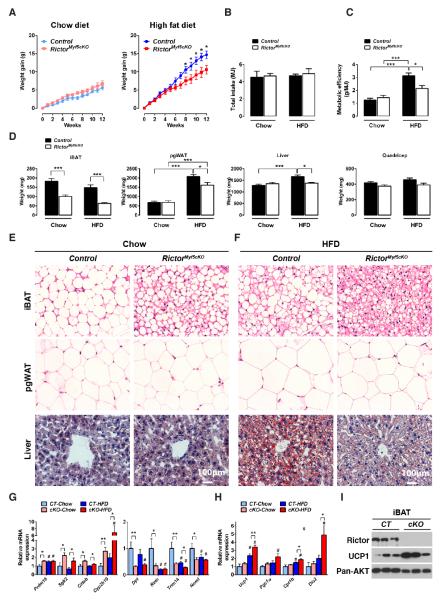
Figure 7. RictorMyf5cKO mice exempt from thermal stress and consuming a high fat diet are resistant to obesity and metabolic disease.
(A)Weight gain of control and RictorMyf5cKO mice during 12-weeks of normal chow (chow) or high fat diet (HFD) (n=8 control and n=12 for KO in chow; n=10 for both genotypes on HFD;mean ± SEM; t-test; *p<0.05). Control mice initially weighed 21.63±0.812g in the chow group and 21.24±0.621 in the HFD group; The RictorMyf5cKO mice initially weighed 19.42±0.305g in the chow group and 19.32±0.348 in the HFD group.
(B) Total energy intake (MJ) during the feeding regimen in (A). Control mice consumed 3.75±0.56g of chow and 2.81±0.12g of HFD; RictorMyf5cKO mice consumed 3.85±0.24g of chow and 2.95±0.35g of HFD.
(C) Metabolic efficiency determined as the amount of body weight increase (g) per MJ food consumed (n=8 control and n=12 KO on chow; n=10 for both genotypes on HFD; mean ± SEM; two-way ANOVA; *p<0.05, ***p<0.001).
(D) Mass (mg) of the indicated tissues collected from control and KO mice after 12 weeks on chow or HFD. (n=8 control and n=12 KO on chow; n=10 for both genotypes on HFD; mean ± SEM; two-way ANOVA; *p<0.05, ***p<0.001).
(E-F) H&E staining of iBAT and pgWAT and Oil red O staining of livers after 12-weeks of eating chow (E) or high fat diet (F).
(G) qRT-PCR of the indicated brown and white fat genes in iBAT from chow or HFD mice (n=8 control and n=12 KO on chow; n=10 for both genotypes on HFD; mean ± SEM; two-way ANOVA; *p<0.05, **p<0.01, ***p<0.001; # indicates significant difference over the control chow group).
(H) qRT-PCR of the indicated metabolic genes in iBAT from chow or HFD mice (n=8 control and n=12 KO in chow; n=10 for both genotypes in HFD;mean ± SEM; two-way ANOVA; *p<0.05, **p<0.01, ***p<0.001; # indicates significant difference over the control chow group).
(I)Western immunoblotsofiBAT lysates.
See also Figure S7.

