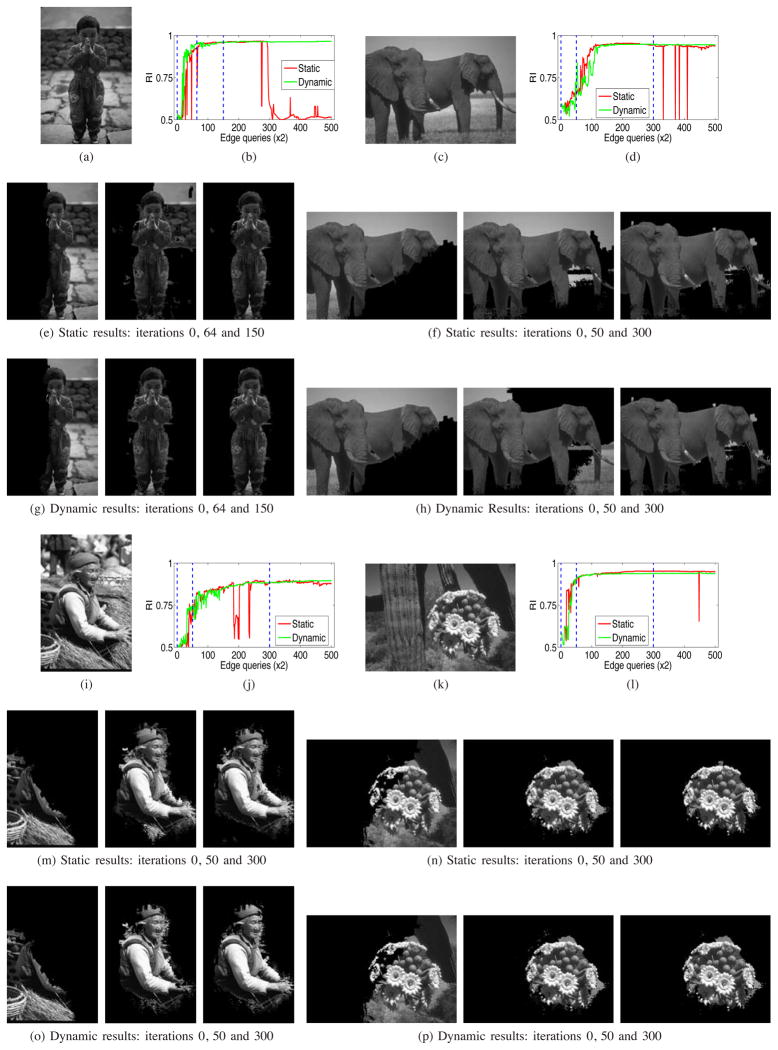
Fig. 7.
Segmentation results of some iterations on four individual images: the first and fourth rows indicate the original gray-value images together with their corresponding RI plot for all iterations. The blue lines over these plots show the iterations whose results are selected to be displayed in other rows. The second and fifth rows show the static results, and the dynamic results are in the third and sixth rows.

