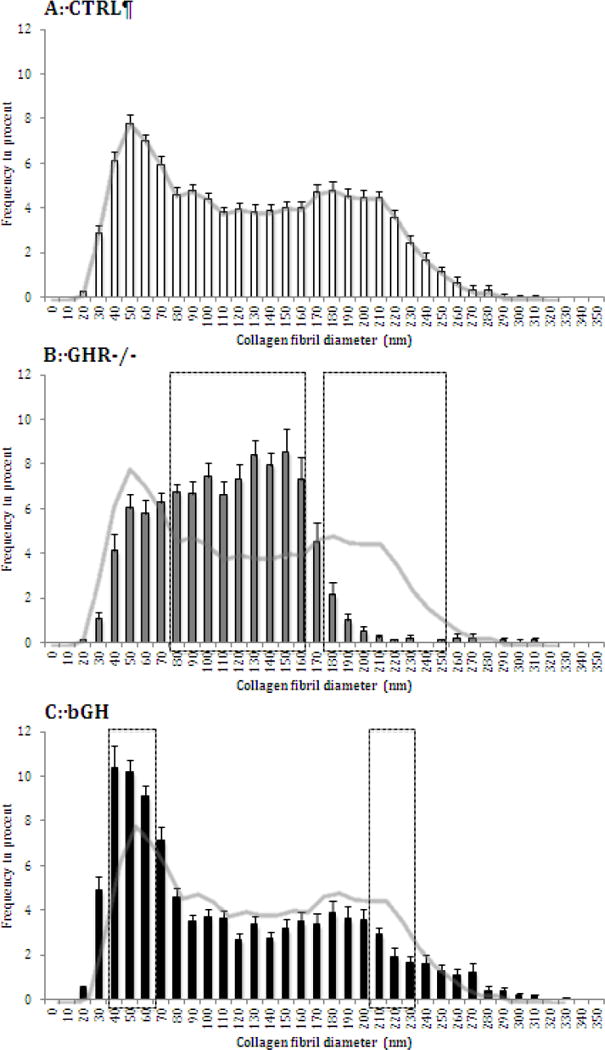
Figure 2. Tendon collagen fibril diameter distributions.

The proximal part of the Achilles tendon was analyzed by TEM imaging in control mice (CTRL, A, n=24) and transgenic mice with chronic low (GHR−/−, B, n=15) or high GH/IGF-I activity (bGH, C, n=15). For each mouse the collagen fibril diameters were measured and the distribution of these are shown for each group. The line-curve for CTRL is shown on A, B and C for easier comparison. The outlined areas in B and C represent diameters where the graphs differ significantly from CTRL (analyzed by functional data analysis, Supplementary data).
