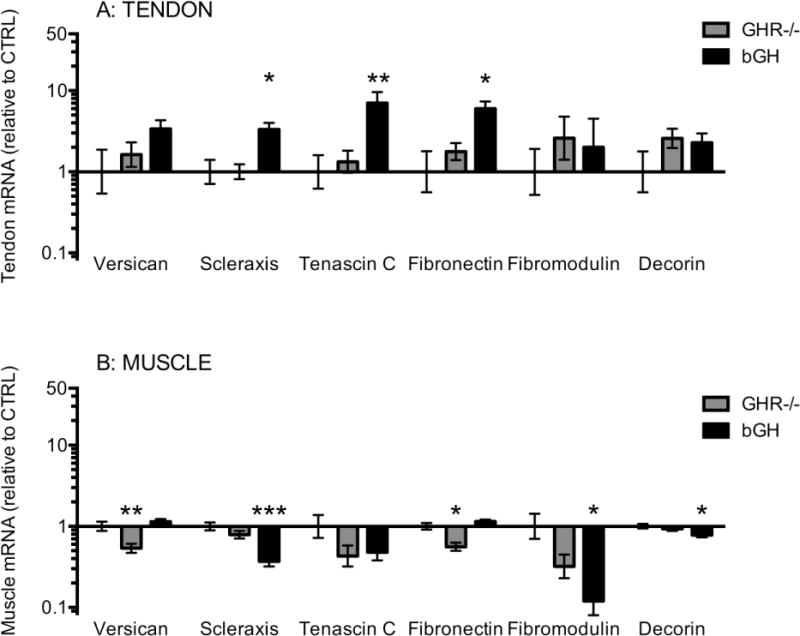
Figure 6. Tendon and muscle mRNA expression of matrix components.

The figure shows matrix protein mRNA levels in Achilles tendon (A) and in calf muscle (B). Mice with low GH/IGF-I activity (GHR−/−, grey bars, tendon: n=8, muscle: n=15) or high GH/IGF-I activity (bGH, black bars, tendon: n=7, muscle: n=14) are shown relative to control mice (CTRL, only error bars visible, tendon: n=12, muscle: n=24). All data are relative to GAPDH mRNA. Values are geometric mean ± back-transformed SEM (*p<0.05; **p<0.01; ***p<0.001, only differences compared to control are shown).
