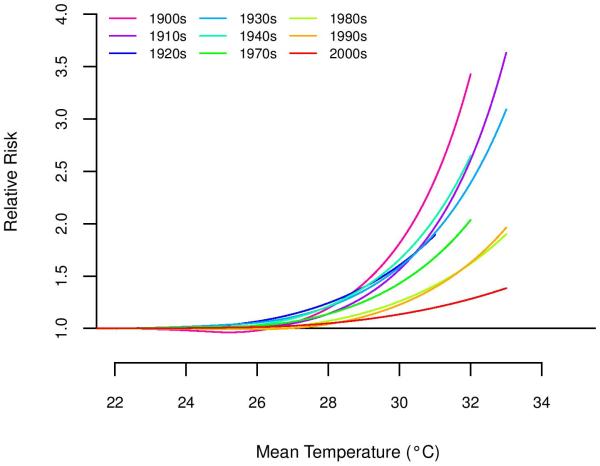
Figure 1.
Temperature – mortality curves of overall cumulative relative risk for New York City by decade, 1900s -2000s. Calculated using a distributed lag non-linear model with a quadratic spline with 4 degrees of freedom for the temperature and a natural cubic spline with 4 degrees of freedom for the lag and 22°C as a reference temperature.

