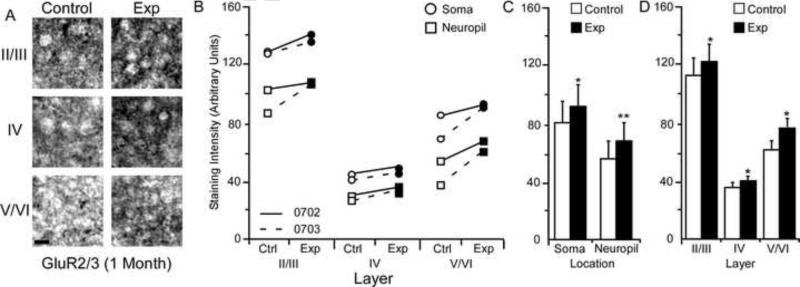
Figure 2.
Changes in GluR2/3 receptor subunit staining 1 month after nerve injury. Figure 2A: Photomicrographs showing qualitative examples of GluR2/3 soma staining between control and experimental II/III (II/III), IV (VI), and V/VI (V/VI) cortical layers 1 month after nerve injury: scale bar 5 μm. Figure 2B: Qualitative scatter-plot showing compared GluR2/3 staining intensity data for all animals across layer and location one month after nerve injury. Figure 2C: Bar histogram showing the quantified difference in GluR2/3 receptor subunit staining between soma and neuropil one month after nerve injury. Figure 2D: Bar histogram showing the quantified difference in GluR2/3 receptor subunit staining between cortical layers II/III, IV, and V/VI one month after nerve injury. * = p < .05; ** = p < .01; *** = p <.001.

