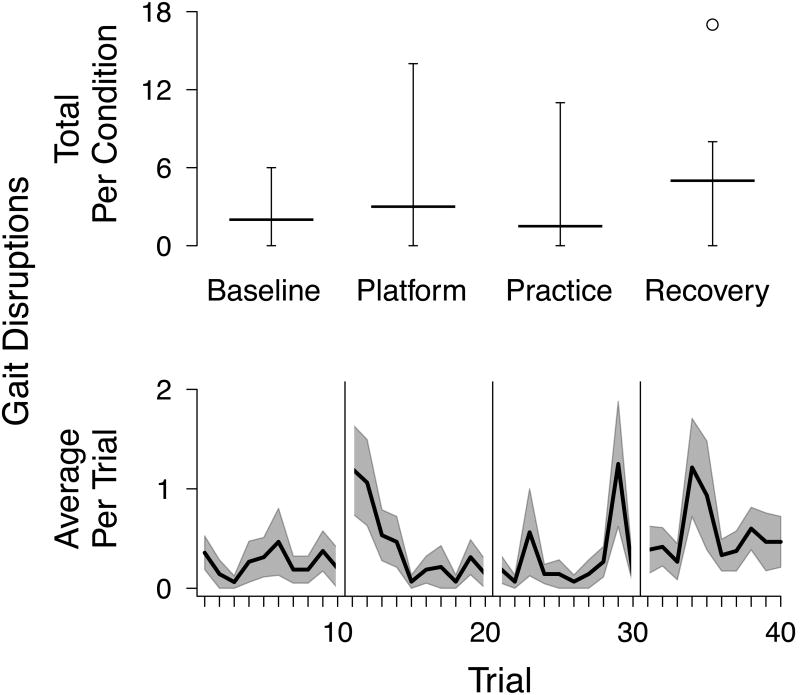
Figure 2.
(A) Total gait disruptions per condition. The solid line represents the median and the whiskers mark the minimum and maximum values. Circles represent outliers (values more than 1.5 times the interquartile range). (B) Average gait disruptions per trial. Shaded areas represent +/- one standard error.

