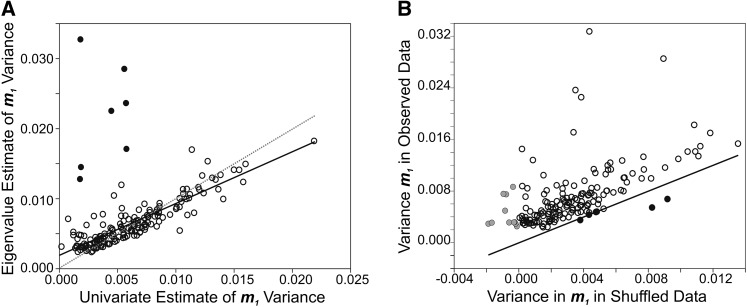
Figure 2.
Examining the bias in the eigenvalue estimates of pleiotropic covariance. (A) We estimated the per-generation mutational variance in the trait combination defined by the eigenvector m1 both as the eigenvalue of m1 (from multivariate analysis using model 2; y-axis) and from the univariate analysis of index traits defined by m1 (the univariate mutational variance from model 1; x-axis). Estimates for all 171 m1 are plotted, with points shaded in black falling more than two standard deviations from the mean difference between the two estimates per trait. The dotted line indicates the 1:1 relationship between estimates, and the solid line indicates the linear regression through the observed points (excluding the seven, shaded, outliers). (B) The per-generation mutational variance in m1 in the observed data (eigenvalue of m1, y-axis) and in shuffled data (after projection, x-axis). The solid line indicates equality (1:1) of variance in shuffled and observed data; six m1 fall below this line and are shown in solid black. The 11 m1 for which there was no variance in the shuffled data (variance less than zero) are shaded.

