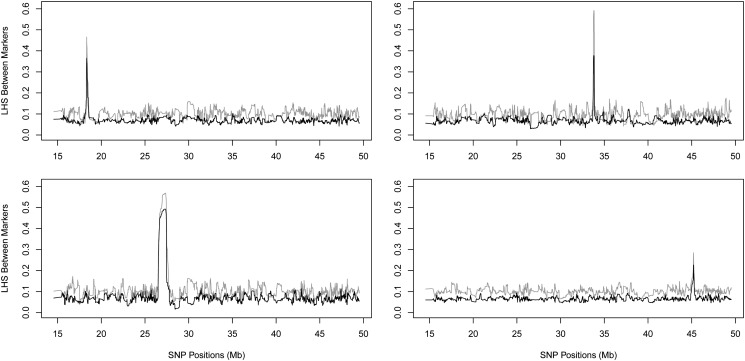
Figure 1.
Examples of LD blocks quantified by mLHS, using chromosome 22 of CEU samples in HapMap3. In all four panels the shaded line corresponds to K = 10 and the solid line to K = 15. The four panels show LD blocks of different strengths and sizes. Note that the observed LD background noise matches the theoretical predictions. See Materials and Methods for details.

