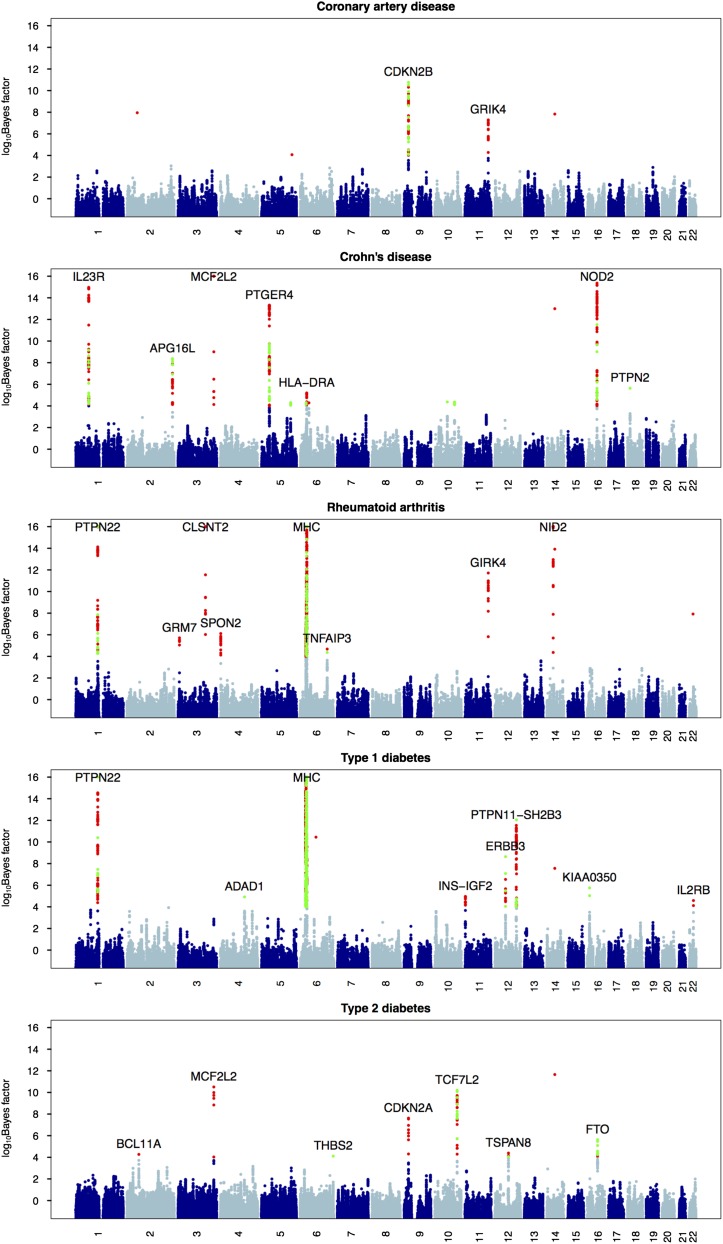
Figure 4.
Manhattan plots for five disease phenotypes in the WTCCC. The log10 Bayes factors are plotted at each marker (values were truncated at 16). The green circles are single SNPs whose log10 Bayes factors are >4; the red circles are core SNPs whose haplotype association log10 Bayes factors are >4. The relevant genes are marked for significant associations.

