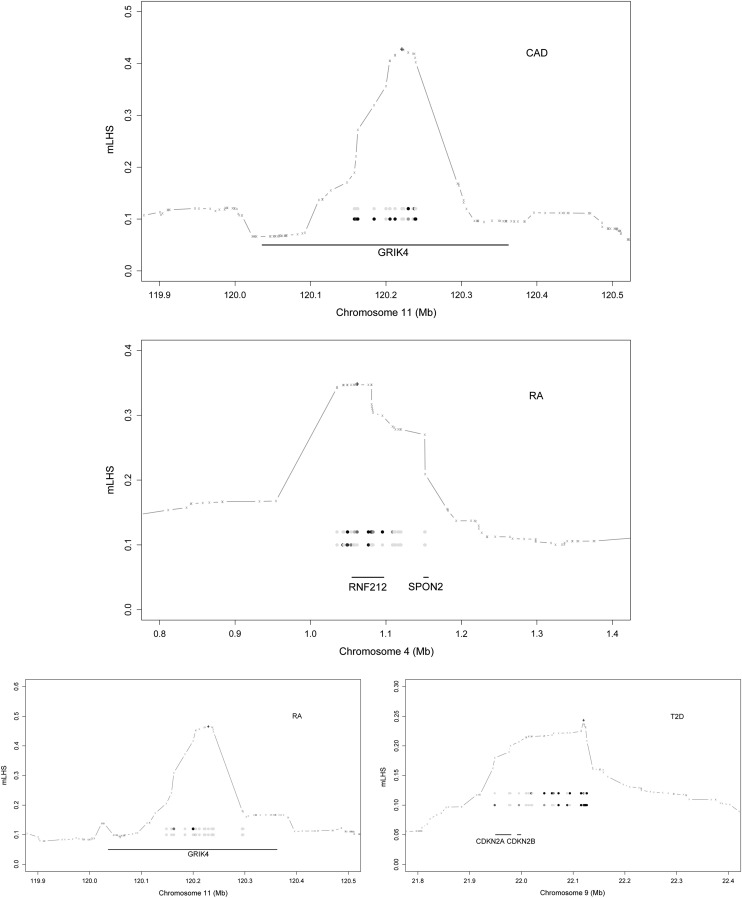
Figure 7.
Details of strong associations. The LD block (based on mLHS) around the most significant signal (marked by “+”) is denoted with a shaded line. The top two ancestral haplotypes whose loadings are strongly associated with phenotypes are expressed as circles, with darker circles representing larger ancestral allele frequencies. The genes within the LD block are shown as solid segments.

