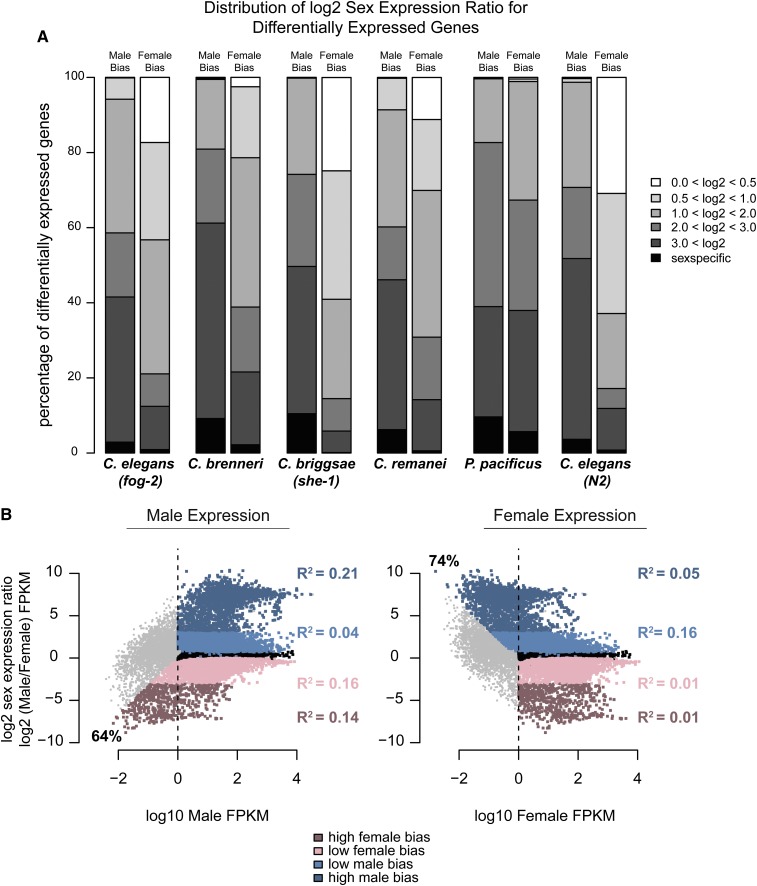
Figure 2.
Distribution of the magnitude of sex bias (log2 sex expression ratio) is different for male- and female-biased genes. (A) Differential expression was determined using DESeq, q-value <0.05. Only genes with FPKM >1 in at least one sex were considered. Male and female expression was determined using cufflinks and reported as FPKM. Magnitude of sex bias was determined by taking the log2 of the sex expression ratio. For each category, male or female, genes were binned by magnitude of bias. Percentage of differentially expressed genes contained within each bin is plotted on the y-axis. (B) For C. elegans (fog-2) the magnitude of sex-biased expression is plotted against the level of expression in males (left) and females (right). Dashed line indicates FPKM = 1. Percentages of high-sex-biased genes with low expression (FPKM <1) in the opposite sex are indicated. Nonbiased genes are plotted in black. Male-biased genes are plotted in blue; female-biased genes are plotted in pink. Darker colors indicate high magnitude of bias. R2 values between magnitude of bias and expression levels are indicated for each category.

