Figure 3.
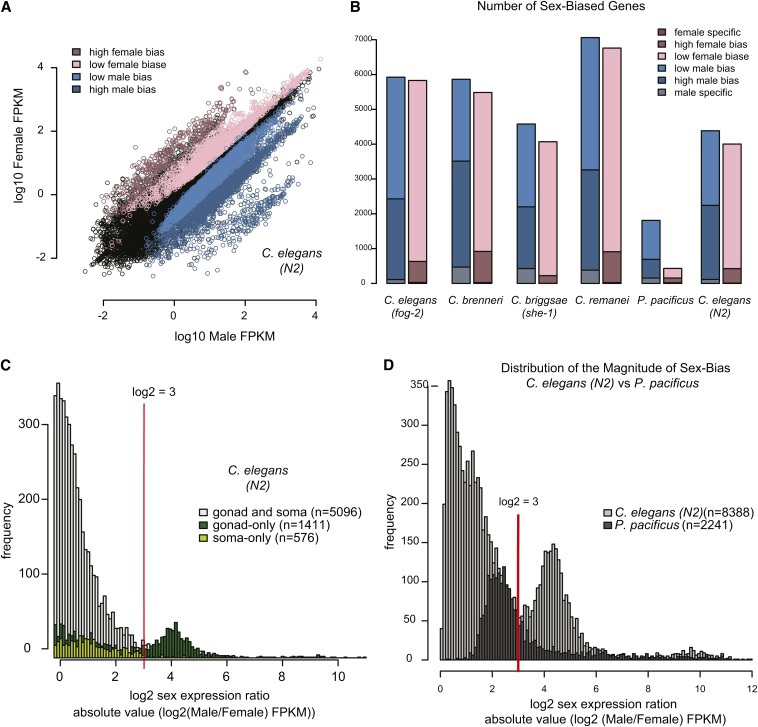
Majority of sex-biased genes are male biased. High magnitude of sex bias is linked to gonadal expression. (A) For C. elegans (N2), male (x-axis) and female (y-axis) expression values (log10 FPKM) are plotted. (B) There is a greater tendency toward male bias in all five species. Number of genes with male (blue) and female (pink) biased expression is plotted for each species. (C) Genes expressed in the gonad show higher magnitude of sex-biased expression. Lists of genes with gonadal and somatic expression were taken from Spencer et al. (2011). Histogram shows the frequency of the magnitude of sex bias for gonad-only (dark green), soma-only (light green), and gonad and soma-expressed (gray) genes. Number of genes in each category is indicated. Red line indicates log2 expression ratio of 3. (D) Distribution of magnitude of sex bias for P. pacificus and C. elegans YA worms. Absolute value of the log2 sex expression ratio was calculated for all sex-biased genes. Histogram shows the frequency of the magnitude of sex bias for C. elegans (light gray) and P. pacificus (dark gray).

