Figure 4.
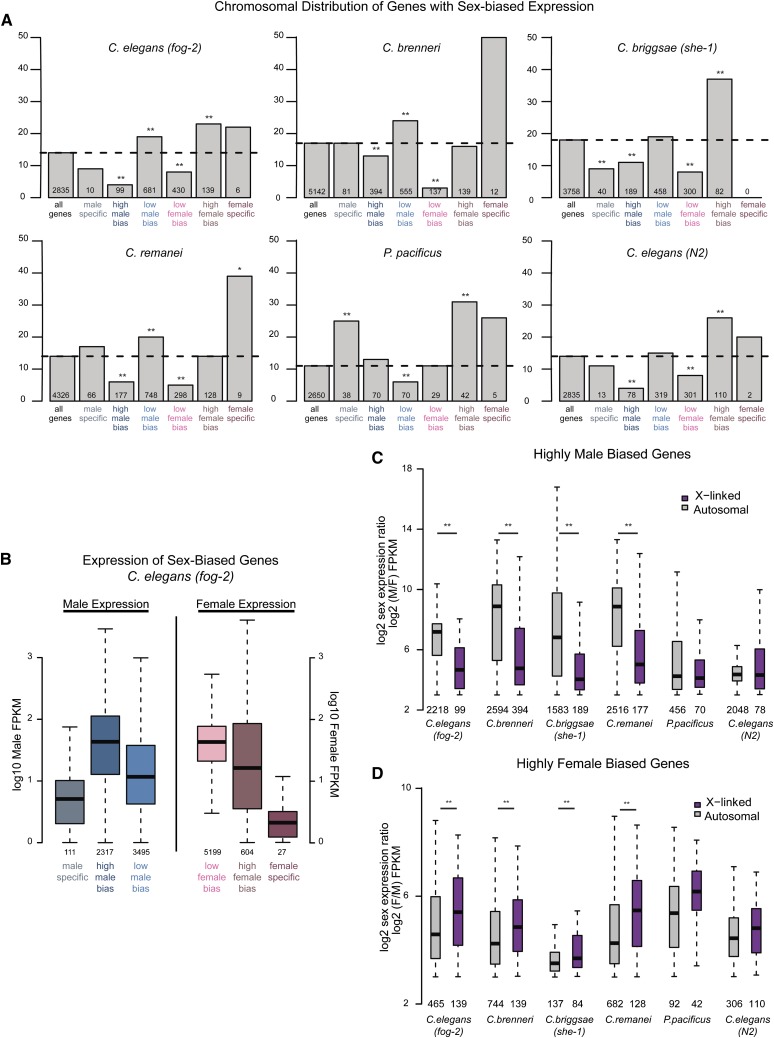
Sex-biased genes are nonrandomly distributed between the X and autosomes. (A) Genes for each species were placed into one of seven categories: all genes, male-specific, high male bias, low male bias, low female bias, high female bias, or female specific (see Materials and Methods). For each category, percentage of X-linked genes is plotted. Number of X-linked genes is indicated below each bar. Significance of enrichment or depletion was calculated using Fisher test: (*)P-value <0.05; (**)P-value <0.001. (B) For C. elegans (fog-2), expression levels of sex-biased genes in each category are plotted. Male expression is plotted for male-biased genes (left three boxes) and female expression is plotted for female-biased genes (right three boxes). (C) Magnitude of male-biased expression (log2 male over female expression) was calculated for each high-male-biased gene. X-linked genes are plotted in purple; autosomal genes are plotted in gray. Number of genes analyzed is indicated below each box. High-male-biased genes located on autosomes showed significantly greater magnitude of sex bias compared to those located on the X chromosome as calculated by t-test: (*)P-value <0.01. (D) As in C, magnitude of female-biased expression (log2 female over male expression) was calculated for each high female-biased gene.

