Figure 8.
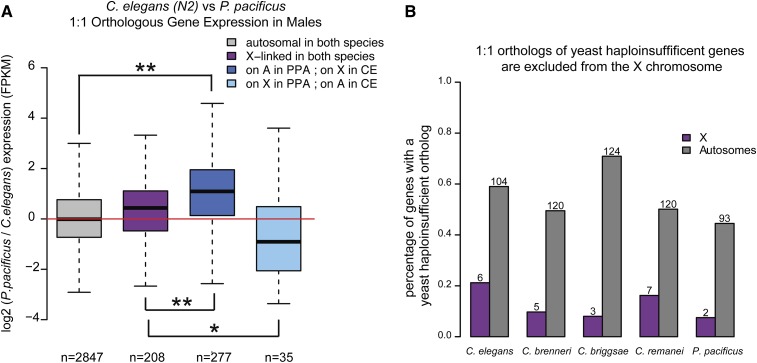
Monosomy of the male X results in lower expression of X-linked orthologs in males. (A) Comparison of gene expression between C. elegans and P. pacificus indicates higher expression of the autosomal ortholog. Log2 male expression ratio (P. pacificus/C. elegans) is plotted for four groups of genes: autosomal in both species (gray), X-linked in both species (purple), autosomal in P. pacificus and X in C. elegans (dark blue), X in P. pacificus and autosomal in C. elegans (light blue). Number of genes in each category is indicated below each bar. (B) Haplo-insufficient genes are excluded from the X chromosome. Orthologs of yeast haplo-insifficient genes were identified in each of the five species (Table S7). The percentage of orthologs that are on X (purple) and autosomes (gray) is plotted. Numbers above each bar indicate the number of haplo-insufficient 1:1 orthologs identified.

