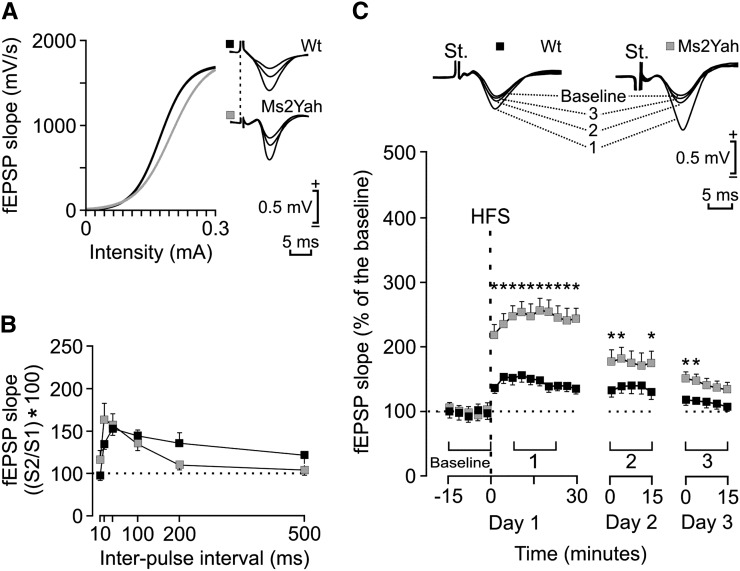
Figure 4.
Changes in long-term potentiation in Ms2Yah mice compared to wild-type littermates. (A) Input/output curves for the CA3–CA1 synapse. A single (100 μsec, biphasic) pulse was presented to Schaffer collaterals at increasing intensities (in milliamperes) while recording the evoked fEPSP at the CA1 area for wild-type (wt, solid squares) and transgenic (Ms2Yah, shaded squares) Ms2 mice. Some fEPSPs collected from the two types of mouse are illustrated at the right. Ms2Yah mice presented input/output curves similar to those presented by Ms2Wt animals. (B) Paired-pulse facilitation. The data shown are mean ± SEM slopes of the second fEPSP expressed as a percentage of the first for six (10, 20, 40, 100, 200, 500) interstimulus intervals. The two groups of mice presented similar paired-pulse facilitation at intervals of 20–100 msec. (C) Top, examples of fEPSPs collected from selected Ms2Wt (solid square) and Ms2Yah (shaded square) animals before (baseline) and after (days 1–3) high-frequency stimulation (HFS) of Schaffer collaterals. Bottom, time course of LTP evoked in the CA1 area (fEPSP mean ± SEM) following HFS for Ms2Wt and Ms2Yah mice. The HFS was presented after 15 min of baseline recordings, at the time marked by the dashed line. The fEPSP is given as a percentage of the baseline (100%) slope. Although the two groups presented a significant increase (ANOVA, two-tailed) in fEPSP slope following HFS when compared with baseline records, values collected from the MS2Yah group were significantly [*P < 0.01; F(24,216) = 10.785] larger than those collected from Ms2Wt mice at the indicated times.

