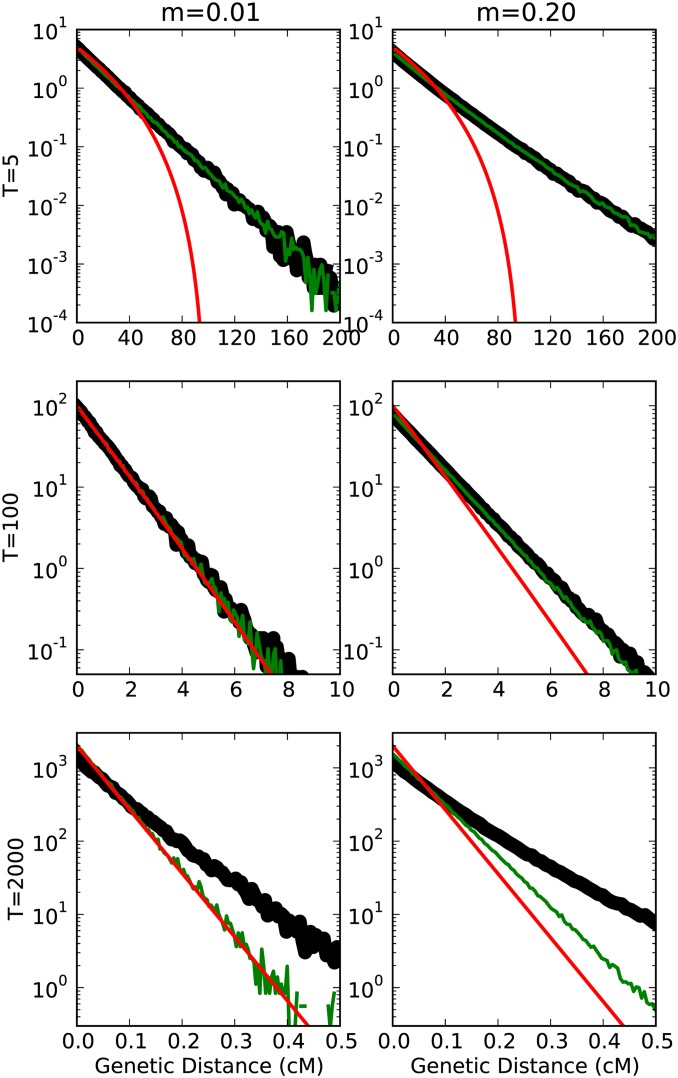
Figure 7.
Tract-length distributions for the Baird distribution (red), PBT model (green), and the WF model (thick black). The WF simulations were run with a population size of 2N = 2 × 10³. Note that the y-axis is shown on a logarithmic scale. When m is small and at intermediate time scales, all three models agree.

