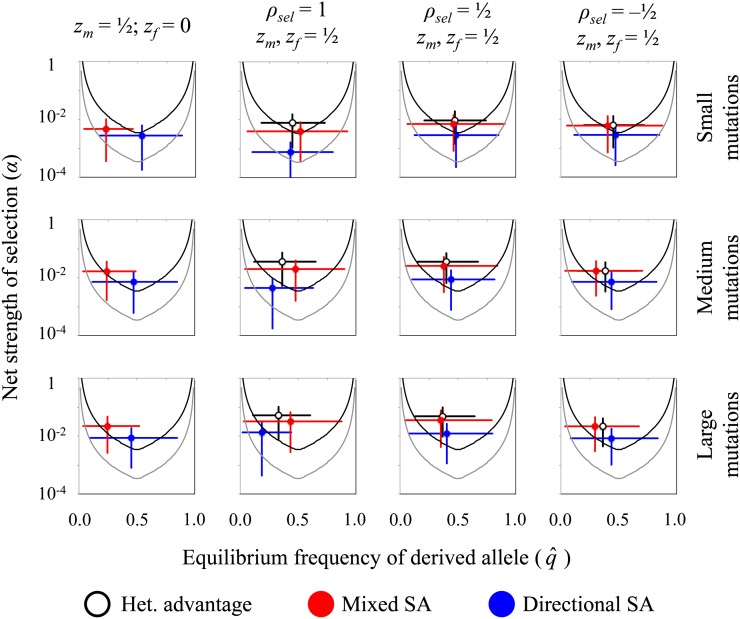
Figure 5.
The efficacy of selection differs between mechanisms of balancing selection. Results show the distributions (means and 75% confidence intervals) of α and for mutations under each of the three forms of balancing selection. The areas above the solid curves represent the parameter space for effectively strong selection, based on Equation 14 with criteria R > 10 (see the text surrounding Equation 14). Gray curves (lower) represent the parameter space for a population with effective size Ne = 100,000; black curves (upper) are for populations with Ne = 10,000. For each balancing selection mechanism and for each parameter set (zm, zf, ρsel), 10,000 balanced polymorphisms were randomly generated using the simulation approach described in the main text. These results were used to calculate means and confidence intervals. For each parameter combination, mutation magnitudes were generated using a bivariate exponential distribution (gamma with shape parameter k = 1), with equal marginal distributions and correlation of ρmut = corr(rm, rf). Three different mean mutation sizes were used: small mutations use E[r] = 0.05, medium mutations use E[r] = 0.2, and large mutations use E[r] = 0.4 {these absolute mutation sizes correspond to male-specific scaled sizes of E[xm] = E(r)(n0.5)/(2zm) = 0.25, E[xm] = 1, and E[xm] = 2, respectively}. Representative results are shown for ρmut = 0.9, n = 25, and ωm = ωf = 1/2, with additional results presented in Figure S4, Figure S5, Figure S6, Figure S7, and Figure S8.

