
Figure 3.
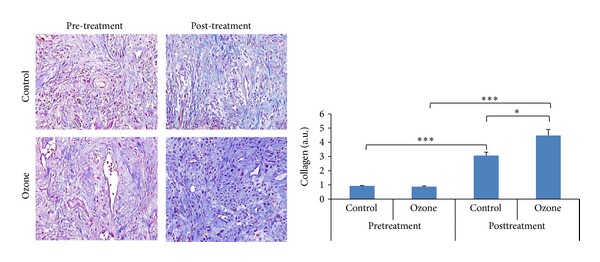
Collagen fibers in tissue specimens by Masson's staining (×40). Before treatment there was no difference in collagen fibers between the ozone group and the control group (0.92 ± 0.04 versus 0.88 ± 0.05, P = 0.433). After treatment there were more collagen fibers than before in both groups (P < 0.001). The collagen fibers were significantly more in the ozone group than in the control group (4.48 ± 0.43 versus 3.07 ± 0.23, P = 0.012). *P < 0.05, ***P < 0.001.