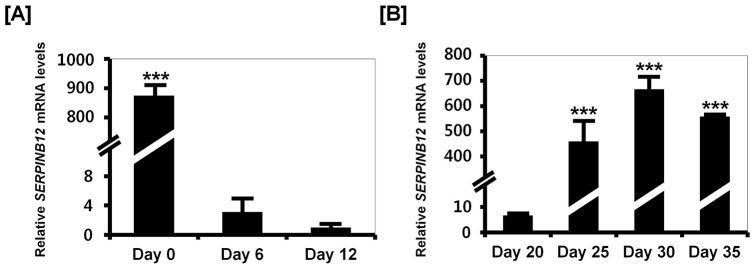
Figure 4. Quantitation of SERPINB12 mRNA during regression and recrudescence of the magnum of laying hens during induced molting.

Quantitative PCR was conducted using cDNA templates from the magnum of hens fed a control diet (Day 0), zinc fed hens in which the oviduct was regressing (Day 6 and 12) [A], and hens in which the oviduct was undergoing recrudescence (Day 20, 25, 30, and 35) [B]. These experiments were performed in triplicate and normalized to control GAPDH expression. The asterisks denote statistically significant differences (mean ± SEM; ** P<0.01 or *** P<0.001).
