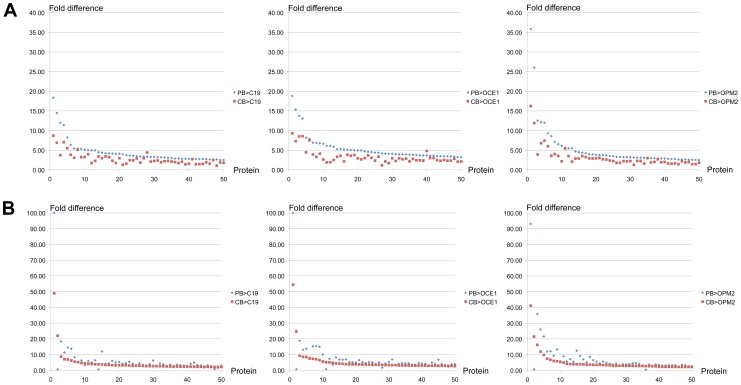
Figure 6. Difference in the level of proteins between adult (PB) and iPSC erythroid cells, compared to that between cord blood (CB) and iPSC erythroid cells.
PB, C19, OCE1 and OPM2 erythroid cells at day 8 in culture were lysed, proteins subjected to trypsin digest and resultant peptides labeled with isobaric tags for nanoLC-MS/MS based quantitation and comparison. The levels of 50 proteins with the greatest differential expression between (A) PB and C19, OCE1 or OPM2 erythroid cells and (B) CB and C19, OCE1 or OPM2 erythroid cells were all compared between PB and the 3 iPSC lines and CB and the 3 iPSC lines. Each point on the x-axis represents a unique protein. Y-axis represents the fold difference in protein level between erythroid cells differentiated from PB or CB and the iPSC line.

