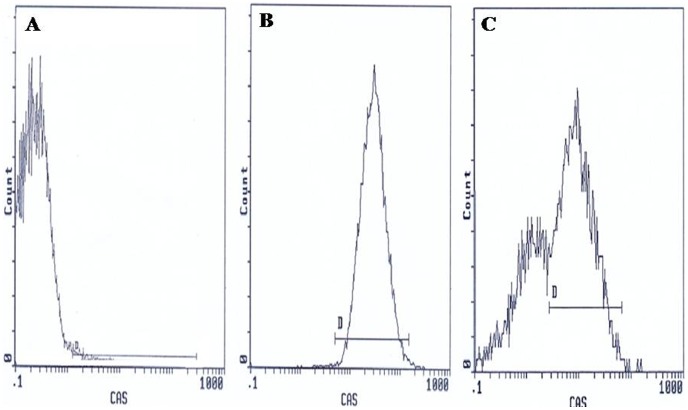
Figure 3. Flow cytometric caspase 3 detection histograms.
(A) Negative control with 0.85% FITC labelled cells. (B) Positive control with 95.8% FITC labelled cells. (C) Semen sample of one male partner of infertile couples positive for C. trachomatis qPCR with 32.5% FITC labelled cells. D: window adjusted to detect the percentage of cells exhibiting caspase 3 activation.

