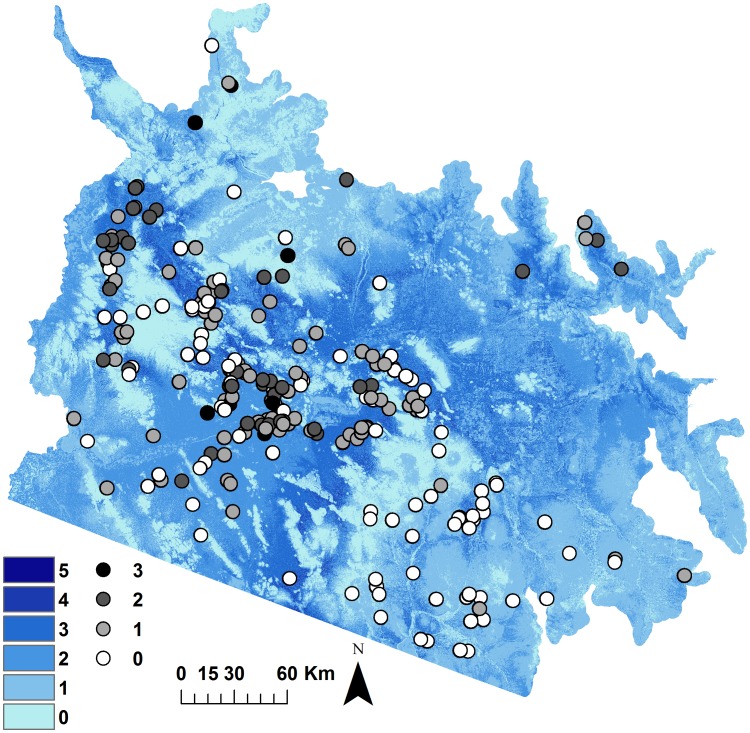
Figure 4. Number of species (black, gray, and white circles) detected in our study area in 2011.
Colored areas show the number of habitat suitability models (Model 4 for winter annuals and Model 5 for Pennisetum) with predicted high habitat suitability (70th percentile). Darker colors indicate greater spatial overlap of high suitability across species.

