Figure 1.

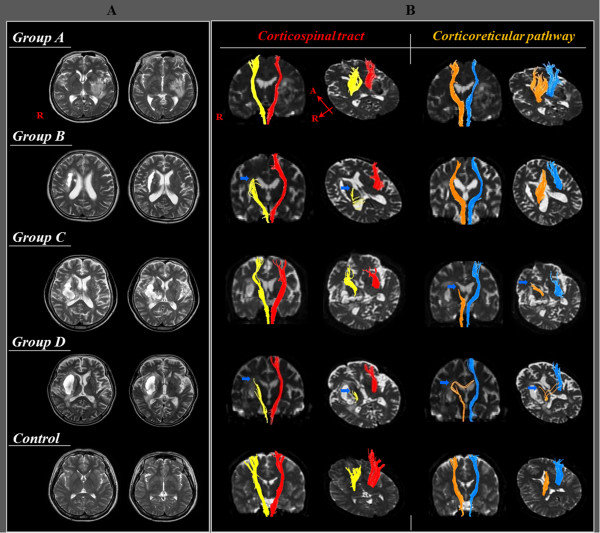
T2-weighted brain MR images (A) and diffusion tensor tractography image (B) of the corticospinal tract and corticoreticular pathway for each patient of four groups and a control subject (arrow: discontinuation of a neural tract).

T2-weighted brain MR images (A) and diffusion tensor tractography image (B) of the corticospinal tract and corticoreticular pathway for each patient of four groups and a control subject (arrow: discontinuation of a neural tract).