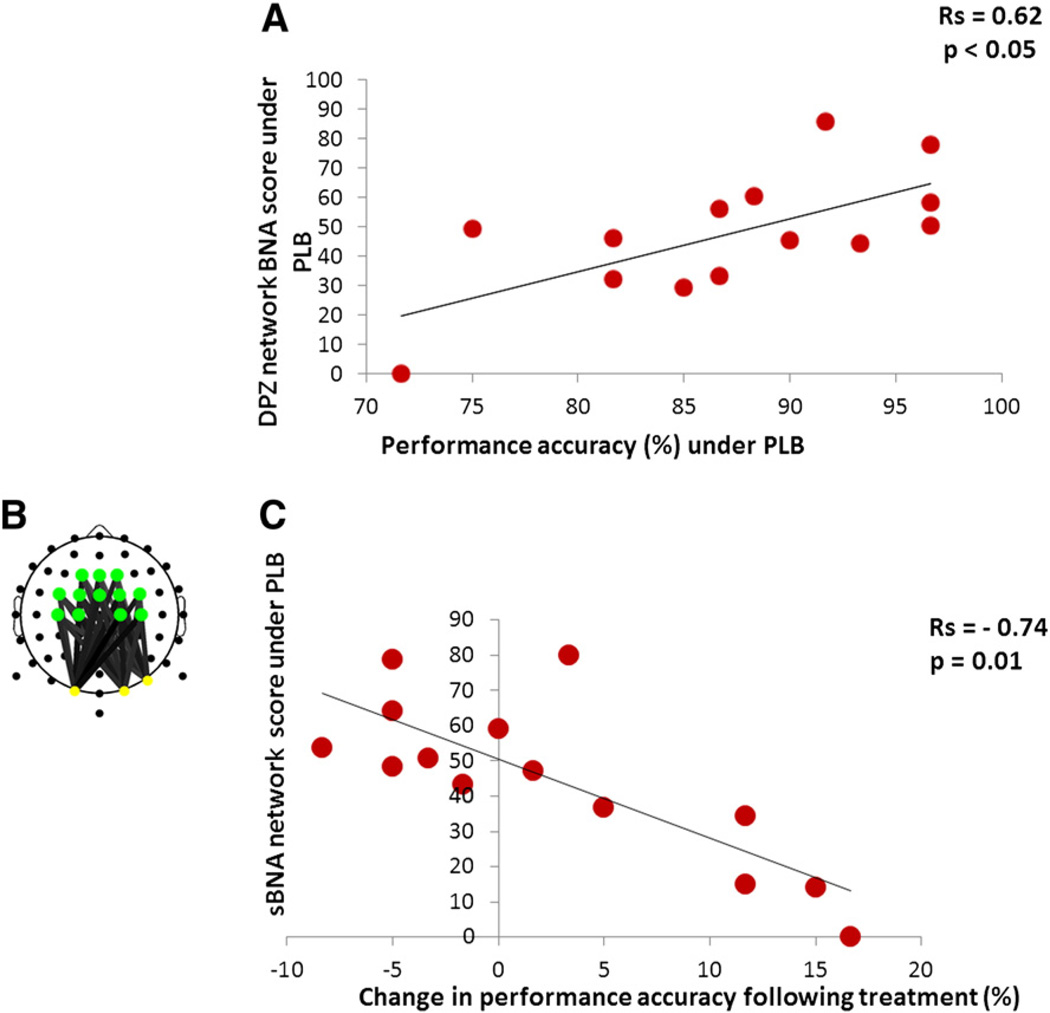
Fig. 6.
Correlations between BNA/sBNA scores and behavioral data. (A) Correlation between BNA scores and performance (under placebo). The graph shows that the donepezil network BNA scores in placebo significantly correlatewith performance on the WM task in placebo. (B) The theta–alpha sub-network (sBNA) extracted from the donepezil characteristic network. See colored legend for node activation in Fig. 5. (C) Correlation between sBNA scores and performance improvement. The graph depicts a significant correlation between the donepezil sBNA scores in placebo and the difference of % correct between placebo and donepezil (% correct donepezil-minus-% correct placebo).

