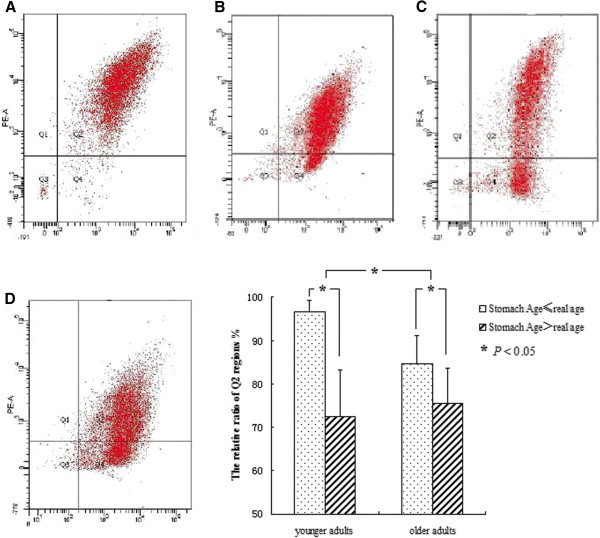
Figure 3.

Measurement of mitochondrial membrane potential (Δψm). A) Overall, 90.82% of cells in the Q2 region and only 2.03% in Q4 (male, 32 years old, Stomach Age 31 years, endoscopy result: CNAG); B) 83.91% of cells in Q2 and 13.49% in Q4 (female, 77 years old, Stomach Age 76 years, endoscopy result: CNAG); C) 69.06% of cells in Q2 and 25.92% in Q4 (female, 30 years old, Stomach Age 52 years, endoscopy result: CAG with slight atrophy and intestinal metaplasia); D) 65.29% of cells in Q2 and 31.37% in Q4 (female, 65 years old, Stomach Age 74 years, endoscopy result: CAG with slight atrophy and moderate intestinal metaplasia). The difference is significant within each group and between the two groups (P < 0.05).
