
Figure 2.
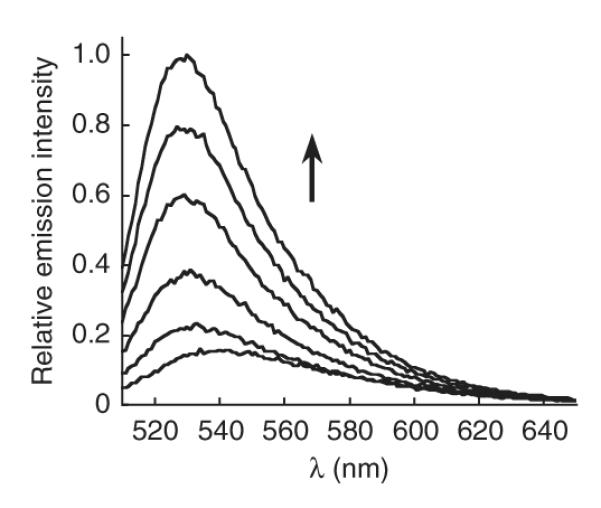
Fluorescence turn-on response of 5 μM MitoPY1 to H2O2. Time points represent 0, 5, 15, 30, 45 and 60 min after the addition of 100 μM H2O2. Excitation at 503 nm.
Official websites use .gov
A
.gov website belongs to an official
government organization in the United States.
Secure .gov websites use HTTPS
A lock (
) or https:// means you've safely
connected to the .gov website. Share sensitive
information only on official, secure websites.
Fluorescence turn-on response of 5 μM MitoPY1 to H2O2. Time points represent 0, 5, 15, 30, 45 and 60 min after the addition of 100 μM H2O2. Excitation at 503 nm.