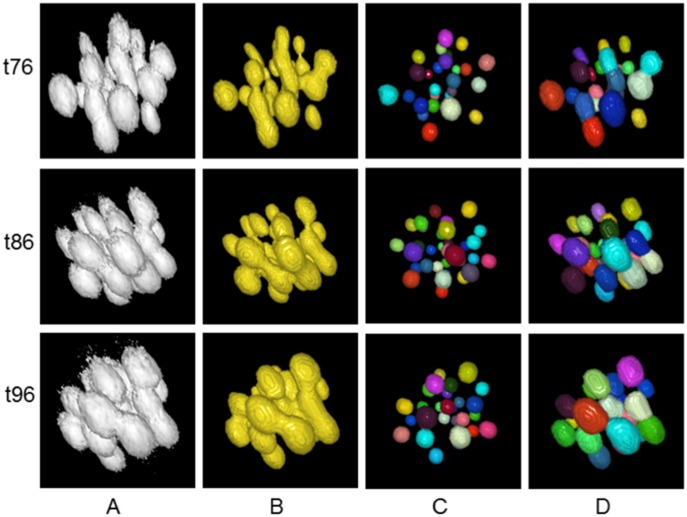
Figure 8. Clustered nuclei separation.
Volume rendered views of the extracted nuclei centroids and volumes for 3D images, obtained by (A) manual threshold, (B) automated threshold, (C) the proposed centroid detection method, and (D) the proposed centroid-driven segmentation method. Sample images contain approximately 32 nuclei, which correspond to the developmental stages at high time-points i.e., at t76, t86, and t96 out of the sub-sequence of 101 images, used in our experiment.

