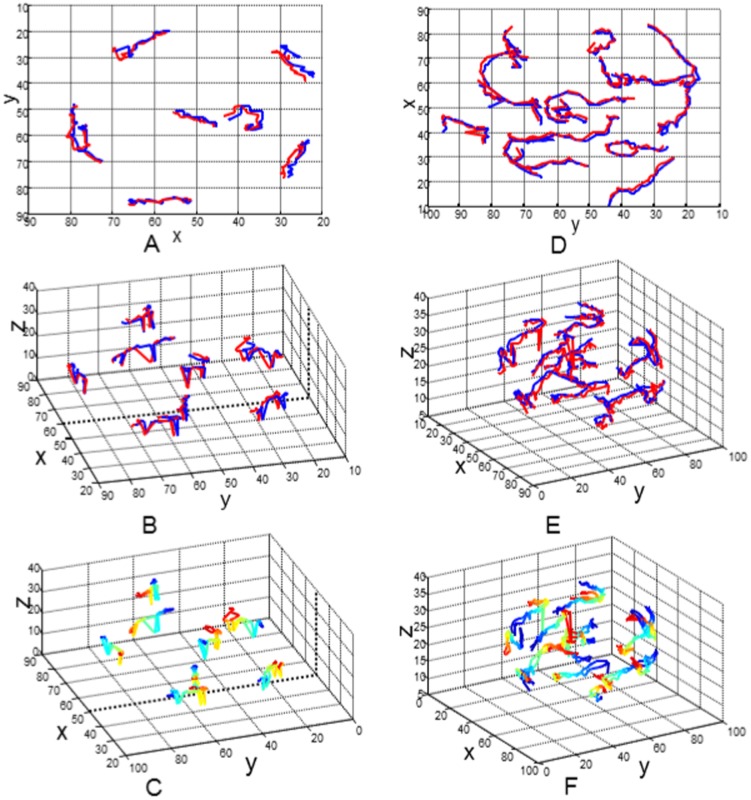
Figure 9. Nuclei tracking results at 8- and 16-cell stages of an embryo.
Nuclear motion tracks in the (A, B, C) 8-cell and (D, E, F) 16-cell stages; Blue and red lines in the 2D projected space (A, D) and 3D space (B, E) indicate the estimated and ground truth nuclear tracks without explicit moving directions; Color gradients in the 3D space (C, F) indicate the directions through which cells move inside the embryo. Blue and red colors indicate the start and end points of the moving cells. Note that twenty two frames (i.e., t1 to t22) at the 8-cell stage and twenty six frames (i.e., t36 to t61) at 16-cell stage are used for track generation. The selected distance threshold ( ) for the correspondence establishment was 25 pixels.

