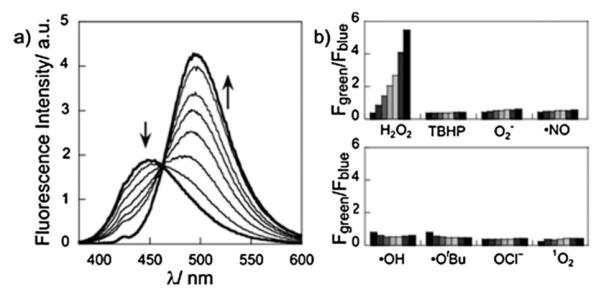
Fig. 1.

(a) Fluorescence response of 3 μM PN1 to 1 mM H2O2. Spectra were acquired at 0 to 60 min at every 10 min and at 120 min after H2O2 was added. (b) Fluorescence responses of 3 μM PN1 to various reactive oxygen species (ROS) at 200 μM. Bars represent emission intensity ratios Fgreen/Fblue at 0, 15, 30, 45, 60, 90, and 120 min after addition of each ROS. Data were acquired at 25 °C in 20 mM HEPES, pH 7.1, with excitation at λ = 370 nm.
