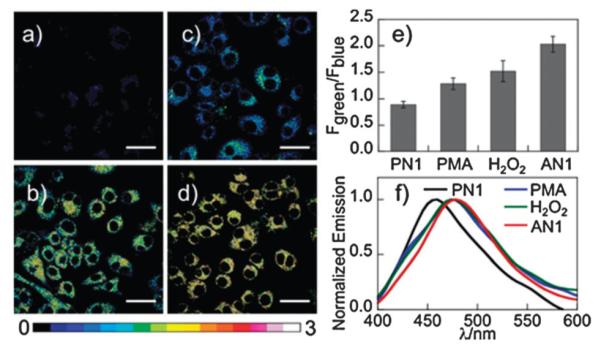
Fig. 2.

Pseudocolored TPM ratiometric images (Fgreen/Fblue) of Raw 264.7 cells labeled with (a) PN1 and (d) AN1. (b, c) Cells were pretreated with (b) 1 μL PMA (1 μg mL−1) and (c) 100 μM H2O2 for 30 min before labeling with PN1. (e) Average Fgreen/Fblue in images (a–d). (f) Lambda mode scanning of PN1, PMA, H2O2 and AN1 in figures (a–d). Images were acquired using 750 nm excitation and fluorescent emission windows: blue = 390–465 nm, green = 500–550 nm. Scale bar = 30 μm.
