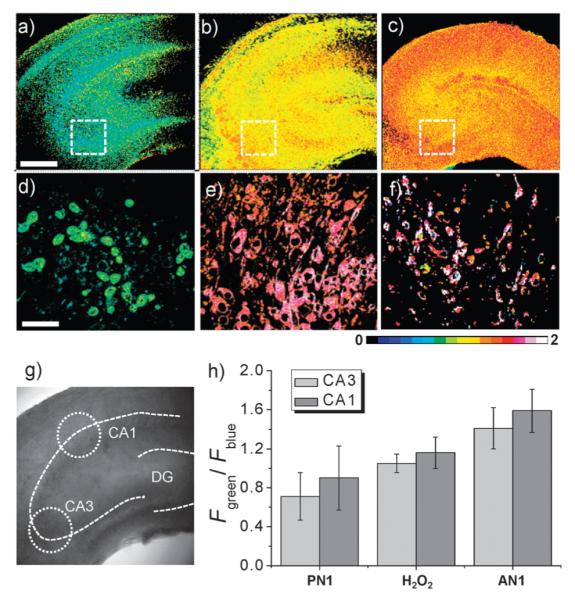
Fig. 3.

Ratiometric TPM image of a fresh rat hippocampal slice. (a–c) Ratiometric TPM images were accumulated along the z-direction at the depths of 90–180 μm (10 images) with magnification at 10×: (a) a hippocampal slice labeled with PN1 (20 μM, 30 min), (b) a hippocampal slice pretreated with H2O2 (1 mM, 30 min) before PN1 labeling (20 μM, 30 min), and (c) a hippocampal slice labeled with AN1 (20 μM, 30 min). (d–f) Enlarged images of (a–c) at 120 μm depth with 100× magnification. (g) Approximate positions (dotted circles) used for measurements of emission ratios in the CA3 and CA1. (h) Average Fgreen/Fblue in (a–c). The TPEF were collected at two channels (blue = 390–465 nm, green = 500–550 nm) upon excitation at 750 nm with fs pulse. Scale bars: 30 μm (a) and 300 μm (d).
