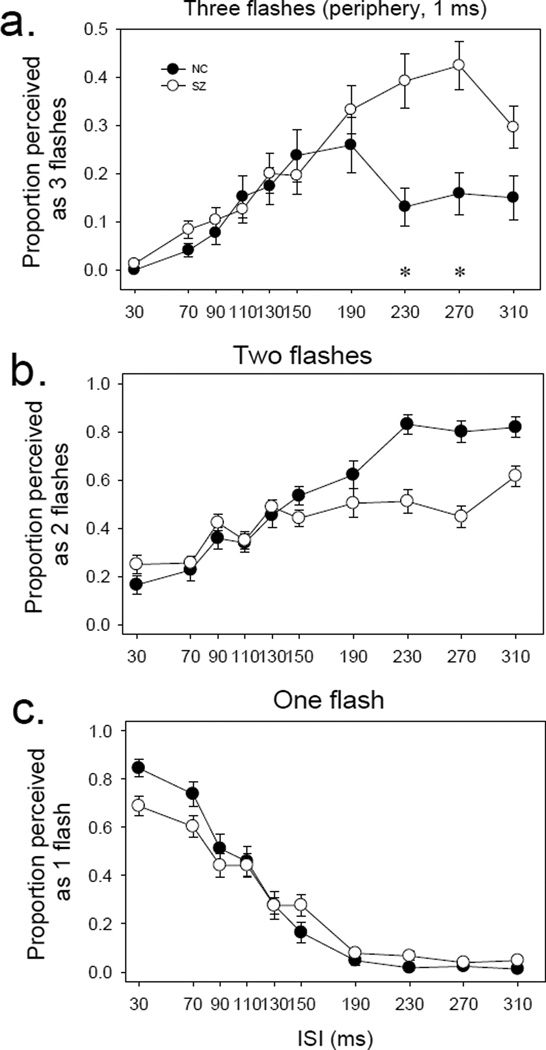
Figure 4.
Perception of one, two or three flashes in the periphery. In all panels (a, b and c), x axis indicates inter-stimulus interval (ISI) whereas y axis indicates proportion of trial perceived as one (bottom), two (middle) or three (top) flashes. Note that the scale of y axis for panel a is amplified by a factor of two as compared to that for panels b and c, to better illustrate the three-flash illusion. The error bars represent ±1 standard error.

