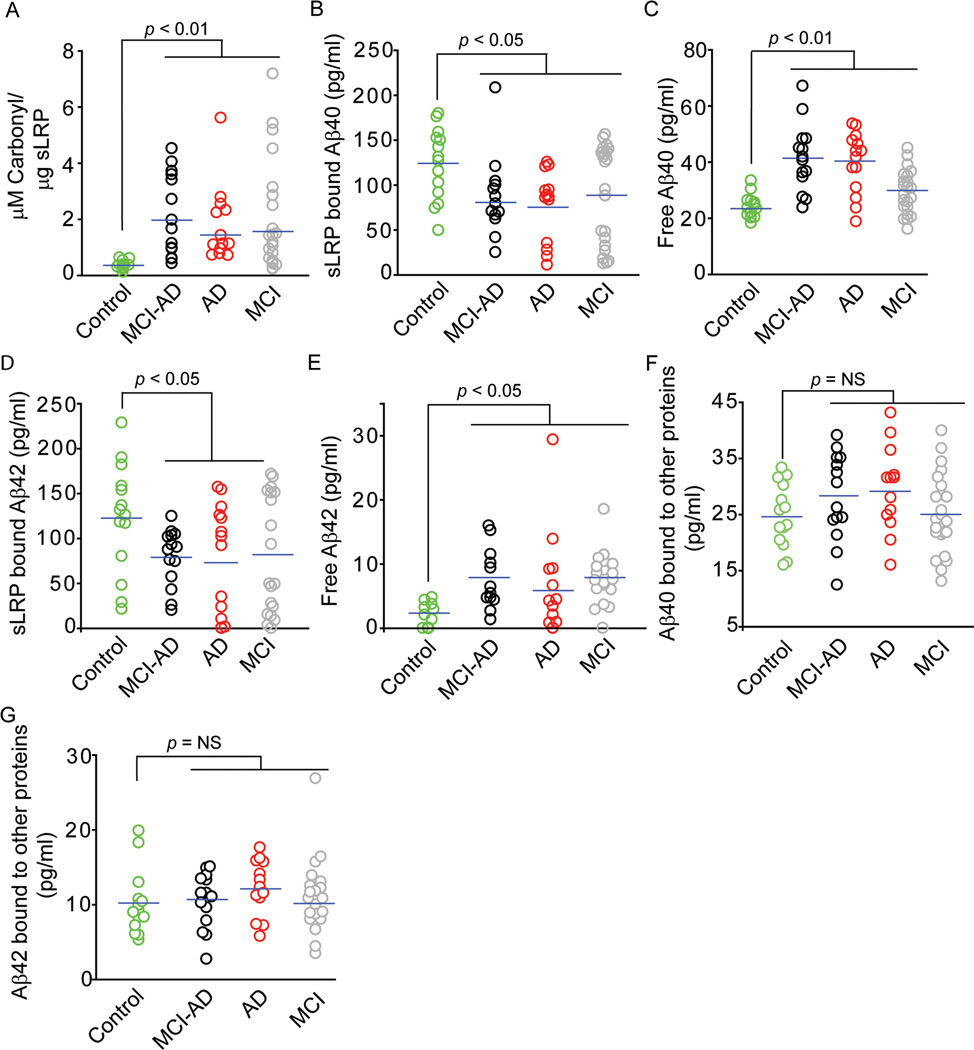
Fig. 1. Changes in oxidized plasma sLRP levels and plasma sLRP bound, free and other proteins bound Aβ fractions.
Oxidized plasma sLRP (carbonyl content) (A), sLRP-bound plasma Aβ40 levels (B), free plasma Aβ40 levels (C), sLRP-bound plasma Aβ42 levels (D), free plasma Aβ42 levels (E), other proteins bound Aβ40 levels (F) and other proteins bound Aβ42 levels (G) in neurologically normal healthy controls (green circles), MCI-AD (black circles), AD (red circles) and stable MCI (gray circles) patients. Points represent individual values from n = 14–24 individuals per group.

