Fig. 2.
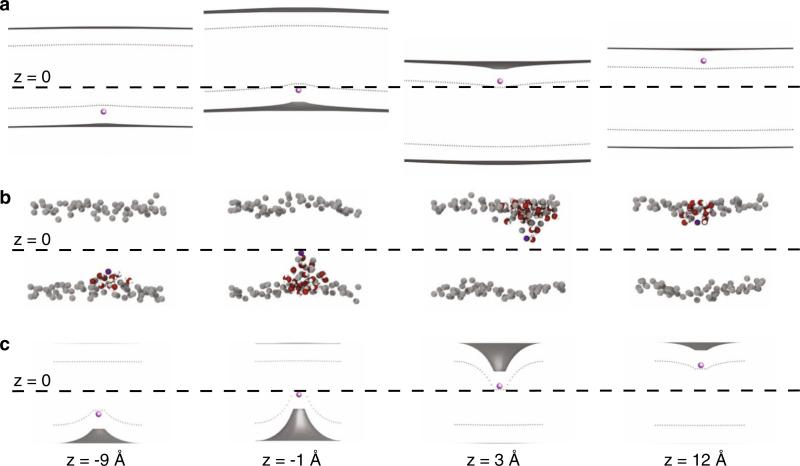
Continuum membrane bending is qualitatively similar to deformations observed in coarse-grained simulations. a Configurations from the continuum membrane bending model for a large patch of membrane with boundary conditions applied at 800 Å from the ion. Panels a–c all show four snapshots of a cation (purple) placed at –9, –1, +3, and +12 Å with respect to the center of mass of the membrane. In panels a and c, the gray surfaces are the membrane–water interfaces, which separate the head group region from aqueous solution. The interfaces between the head group region and the membrane core are shown as gray dotted curves. A search was carried out to identify the optimum membrane shape that minimizes the system energy for each ion position. The membrane undergoes large deflections in the z direction to avoid penetration of the ion into the hydrocarbon core. These deflections are most pronounced when the ion is near the center at z = –1 and +3 Å causing shifts up and down, respectively. When the ion is at –9 and +12 Å the bilayer undergoes very little deflection from the flat, unstrained state. b Snapshots from a coarse-grained MD simulation of Na+ penetrating a DPPC bilayer using the MARTINI forcefield. The membrane is approximately square with a side length of 65 Å, and it is composed of 128 DPPC lipids. The phosphate beads are gray, and penetrating waters are red and white. Starting with an identical flat, equilibrated bilayer, 71 independent umbrella sampling simulations were performed with the ion restrained at positions along the membrane normal. The small leaflet deformations occur at –9 and +12 Å, but large membrane bending occurs when the ion is near the center of the bilayer in the middle two snapshots. c Configurations from the continuum model for a small patch of membrane with a 19.5 Å radius. For this small patch, more similar in size to the system in panel b, the membrane is not able to adopt a low energy, large scale deformation to avoid penetration by the ion. The leaflet being penetrated bends sharply, while the opposite leaflet adopts a more gentle bend to relieve compression just as in the coarse-grained simulations in panel b (Color figure online)

